
Return to Financial Insight's main page.

![]()
The following are Financial Insight articles. Please note the dates at the top of the articles, indicating when the article was published, especially the first date published, as that would indicate when it was originally written. Remember that many were written a long time ago and while a lot of the advice is still unchanged, circumstances do change and therefore in some cases the advice today could be different.
Click on an individual article to jump to it, or scroll down through all the articles.
Computer Models: The Great Deception
Why Should Shareholders Pay Twice for Management's Mistakes?
We are Looking For Good Companies, Not Perfect Ones
Selling, One of an Investors Toughest Decisions
Are Prices High, Earnings Low, Or Something Else.
Buying and Holding Quality is Still Our Favored Approach
Before looking at PE's, Take a Good Look at Earnings
When Too Much Safety Increases Risk
Derivatives Should Be For Hedging, Not Speculating
How to Build a Stock Portfolio
To Lease or to Own, A Consumer Dilemma
Borrow or Pay? A Consumer Dilemma!
A Strategy for Fixed Income Securities
A Discussion on Mutual Fund Fees
Use a Mixed Approach to Build Your Portfolio
Price Targets Are Good For Brokers. But Are They Good For You?
In Defense of the Oil Industry
What Is A Mutual Or Investment Fund?
Stocks are Overvalued, Well Some of Them Are!
Are There More Mutual Funds Than Stocks
The Relationship Of Short Term Results To Future Returns
Selecting Equity Mutual Funds, A Quality Exercise
Is the Market Overvalued? What About Your Portfolio or Mutual Fund?
You Do Not Need A Fortune to Build A Diversified Portfolio
After The Dust Settles, It is Future Earnings That Count
Short-Selling; Risky Speculating, But Is It Investing?
The Stock Market, Bull, Bear Or A Number of Independent Companies
Small Cap Companies For Maximum Growth
The Big Multinationals, Maybe The Growth Companies Of The Twenty First Century
RRSP's & RRIF's: The Power Of Sheltering
Dave's Comments on the Recent Events of Bre-X
Buying On Margin For Bigger Returns and Bigger Losses
Diversifying, How Much is Enough?
Market Timing Can Improve Your Returns, But You Better Be Good!
Myths of Load Verse No Load Funds
The Canadian Government's 1998 Budget
TIPS & HIPS, An Alternative to Mutual Funds
There Is More To A Company Than Just Numbers
Some Portfolios Go Up During A Crash
The Emerging Markets, Big Winners Or Losers
The Other Way To Invest Internationally
Market Review and The Quebec Referendum
When Selecting Mutual Funds, Pay Attention To Management
Looking For Quality Equity Mutual Funds
RRSP's and Shelters, Which Investments Should You Shelter
After Considering Inflation, Interest Rates Seem Pretty High
![]()
Published: November 25, 2014
Like many tools, when used properly computer models can be a great aid. They allow us to efficiently run what if scenarios and make some useful comparisons. In the investment world, these kinds of analysis can be very helpful. We even have one that is available free on our website, IFC Stockvaluator. It is a wonderful tool that helps us evaluate different stocks. It allows us to see different ratios, their trends, to chart different growth rates and to calculate an intrinsic value of a stock. This can be very helpful when kept in perspective; it can also be very dangerous if overemphasized.
There are two glaring weaknesses in any model. The first more obvious one is the old garbage in garbage out rule. If the data you input is not correct, well then neither is your output. The second less obvious weakness is that if the model does not correctly identify how different parameters interact (or omits important parameters) then the results will be wrong regardless of how good the inputs are.
So let's take a look at Stockvaluator. It calculates an intrinsic value of a stock based on one very important premise. It assumes that a stock is worth the discounted value of all its future earnings. We believe that is what a stock is ultimately worth. If however, our assumption is incorrect, then all bets are off. We would argue that while many things affect a stock's price, at the end of the day, it usually comes down to future earnings. If we are right we may have a useful tool, if not then we have a disruptive tool. Of course, even if our premise is basically right, if we do not correctly get how the variables interact, or miss some important variables, then even if the calculations are perfect our results will be wrong. Then there are the inputs.
In the case of Stockvaluator, there are several inputs that you have to enter after reviewing the company's ratio and earnings history. First there is the earnings per share starting point. This may seem simple, but maybe the current year is an anomaly. Then there are the growth rates. Crystal ball anyone. Finally there is the discount rate. You may know what you expect but what does the market expect and how quickly that can change.
So you might ask why we use this modeling tool. Well, it does allow us to run what if scenarios, for example, what if we raise or lower the discount rate, or what is the effect of different growth rates. We can also compare our results to what the market is telling us. Does the stock appear to be of good value, or are the differences significant and maybe we should have a lot more questions? Again, a great tool when used correctly and we do not over rely on it. This brings us back to our title, The Great Deception.
If you watch the investment press or listen to many if not most brokers and portfolio managers, it seems as if no one wants to do their job any more. Instead of doing the work of carefully analyzing companies and building solid portfolios of high quality companies, everyone is looking for a short cut. They seem to believe that they can create these computer models that will identify key factors and move in and out of stocks or markets and thus outperform them. Well, if you build enough different models, some will work, some of the time, sometimes for quite a while, but none will work all the time and some will build your confidence before letting you down in a big way.
While models have a place, they are just a tool. The world is just too complicated and it is constantly changing. There is no way that any model can take into consideration all or even most of the different parameters, know what they will be and how they will interact with one another. Yes, you can figure what would have worked for the previous year, maybe even decade, but nothing stays the same. We have no doubt that many if not most of the people building and promoting these models really believe that their models will work. Maybe after all their time and effort, they need to believe it. Maybe that is the Greater Deception. But do not be taken in, when it comes to something as complicated as the investment world, Computer Models are a tool, one of many, nothing more, nothing less.
Return to top of page.
Return to Financial Insight's main page.
![]()
Published: 2012
There is an old Accountants/Auditors joke. I first remember hearing it in 1978 when I was a young Auditor with the Office of Auditor General of Canada. It goes something like this:
People are being interviewed for a job. The first one is asked the question "What is one plus one." The applicant frets over it a minute, it must be a trick question. But finally answers."Two." The second applicant is also asked "What is one plus one." This applicant also frets over it a minute, it must be a trick question. But finally answers."Two." The final applicant is an Auditor and is asked "What is one plus one." The Auditor thinks a minute, then thoughtfully answers. "What would you like it to equal?"
There is the old adage that numbers do not lie. Maybe not, but they can certainly be misleading. The same goes for statistics, charts and rules, if they are not applied correctly. In this case I am going to discuss charts.
Following are a number of charts showing investment returns. Take a minute and have a look. Which ones do you like?

So which ones look good? At first glance, would you say that Chart B (top left hand) looks like a pretty smooth but only slightly upward return, Chart D (top right hand) is downward, while Chart A (bottom left hand) goes up but is very volatile and that Chart C (bottom right hand) has a nice steady upward trend?
Now look more closely. Would it surprise you to know that all of these charts represent the return of my personal portfolio? That's right, these are all different representations of the same portfolio, yet at first glance they each seem to tell a different story. All I did was play with the scales and the time frame. Which one someone shows you might depend on what message they want to convey.
Chart B is a log chart of January 1 1998 to December 31, 2011 (14 years). Normally I like log charts, as they make a straight line a straight line. That is they adjust the scale as the values increase which removes the distortion of an investment with a steady return taking off. Let me explain. On a normal chart, a 10% return on $1,000 is $100 while on $10,000 it is $1,000. Therefore, a constant 10% return looks steeper as the value increases. So on a regular chart the current returns can look better or more volatile than older ones only because they are on a larger scale. On a growing portfolio, a logarithmic chart removes this distortion and can be more meaningful. Chart A (below chart B), is the exact same data, but on a normal chart. The problem with Chart B is that because scale is so large it has flattened out everything and is hard to decipher. The problem with Chart A is that the more current numbers look more volatile because for example a 25% drop on $3,000 is 3 times larger than a 25% drop on $1,000. Below I will show a better logarithmic chart but for now let us move on to Charts D and C.
If you look closely at chart D you will note that it goes for the relatively short period of May 2007 to February 2009 while Chart C goes from a little longer period of May 2003 to September 2007. If I want to brag, I would show you chart C, steady growth with minimum dips. If I want to scare you I would show you chart D and tell you how the stock market is for losers.
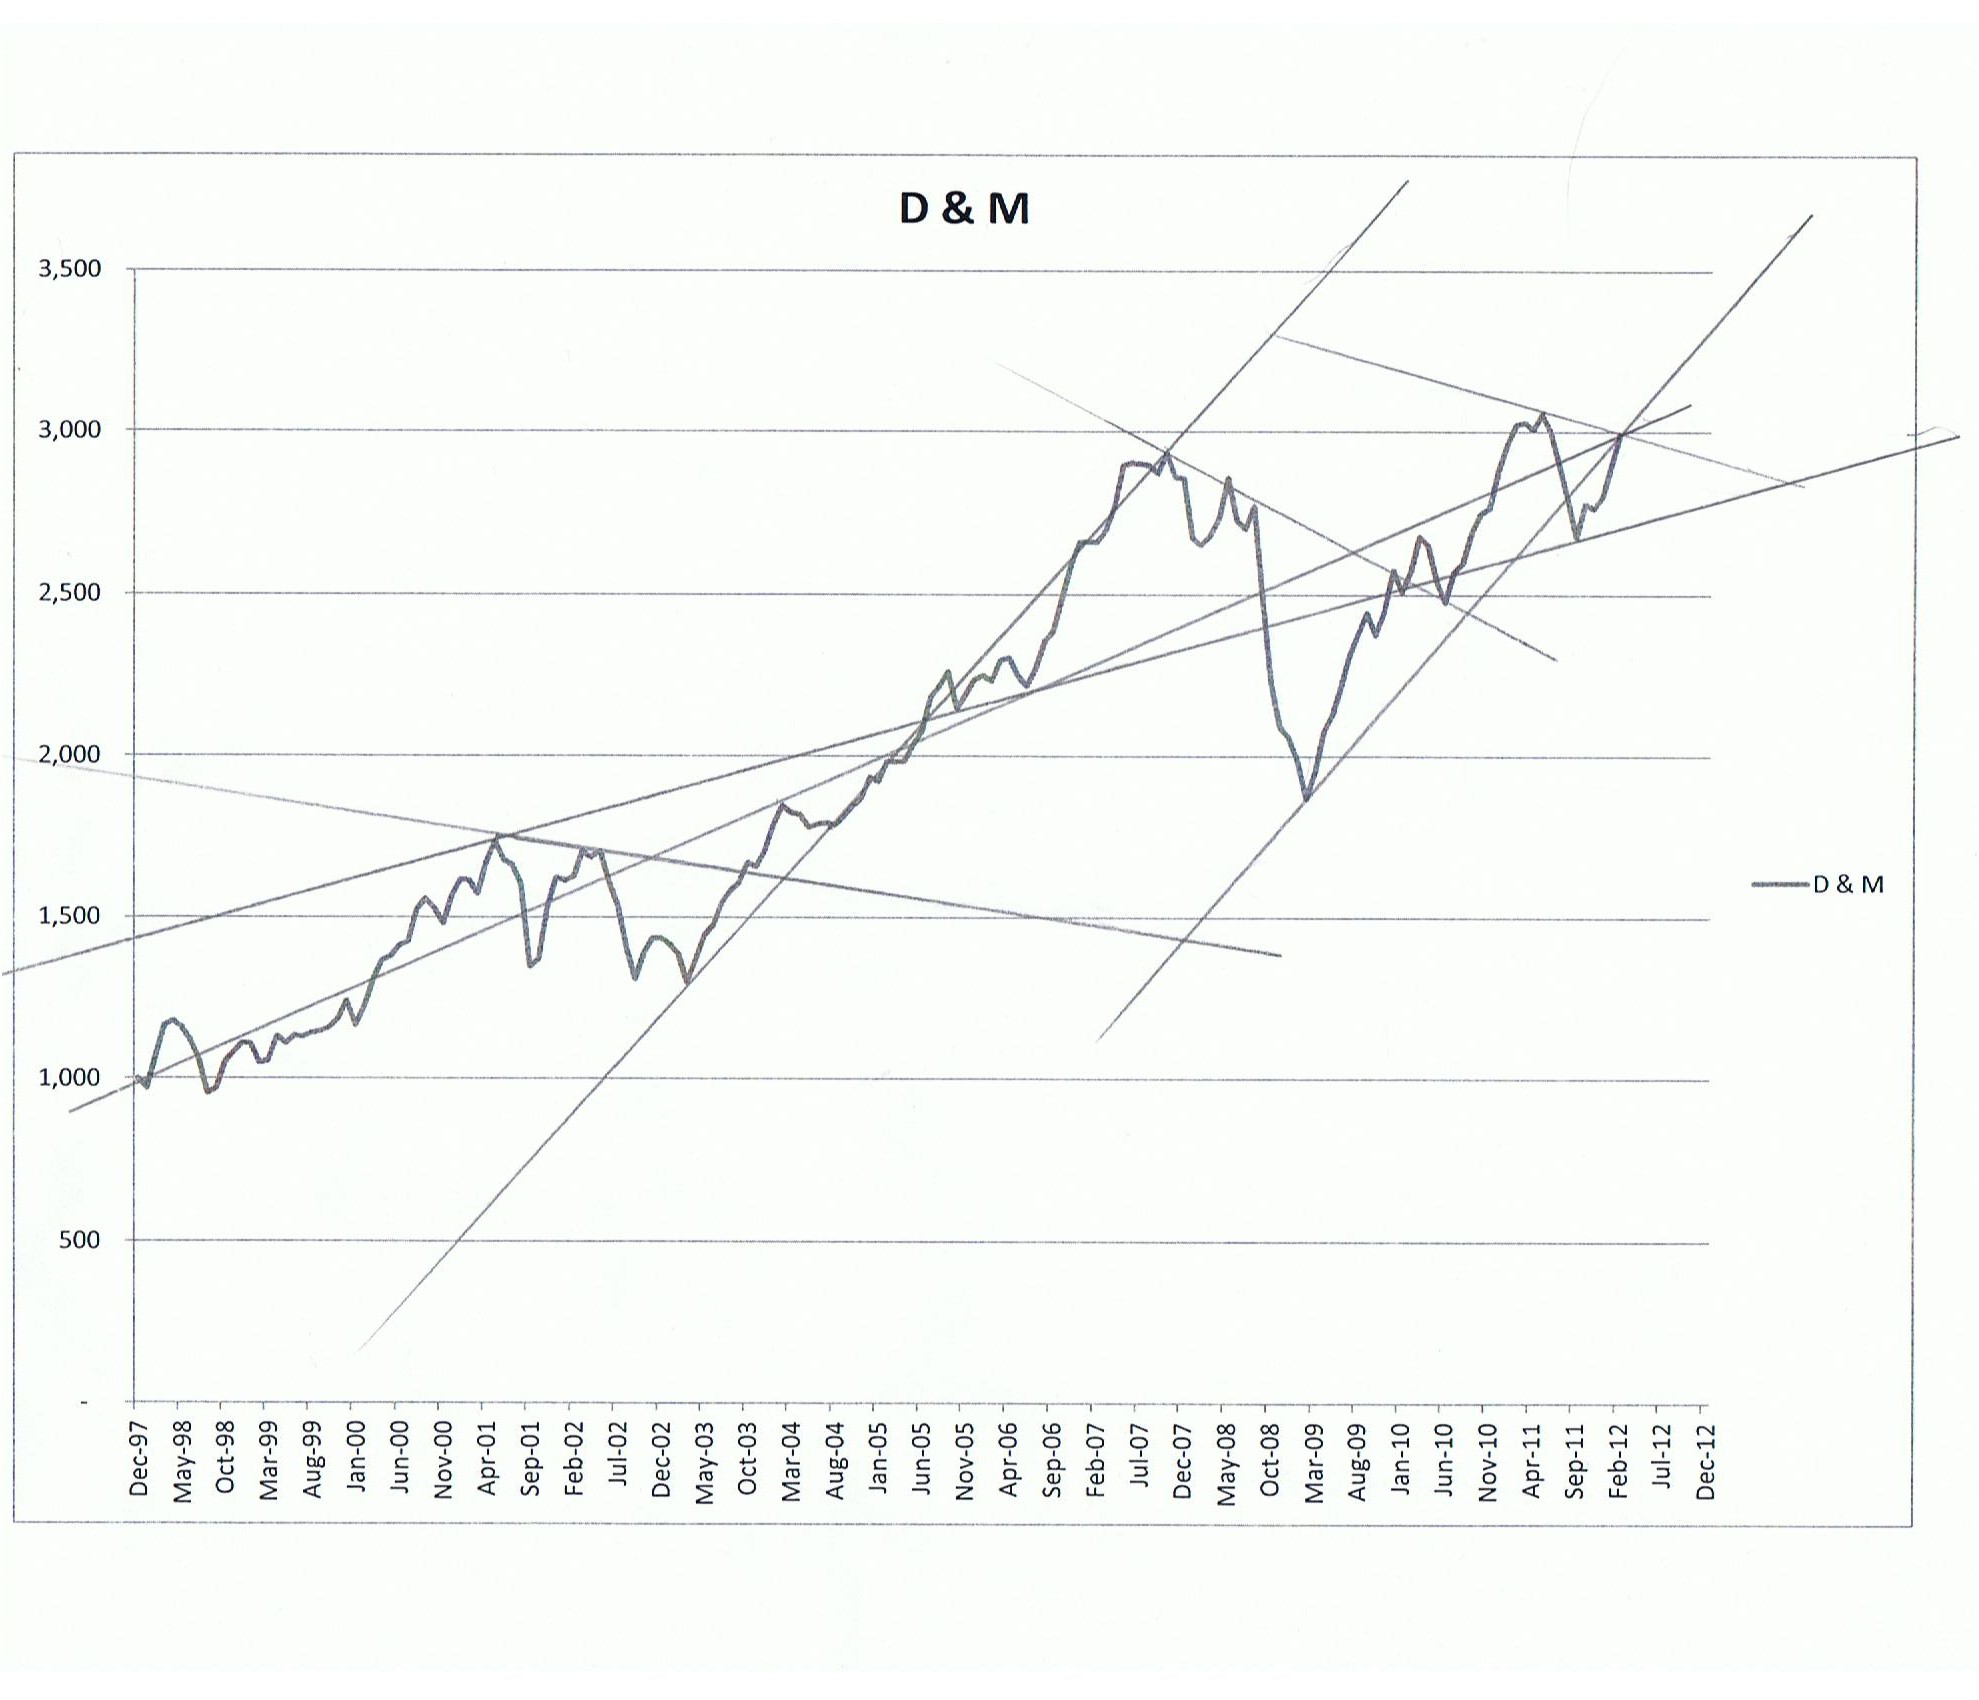
Now for emphasis below is Chart D&M It is really the same as Chart A but with a whole lot of trend lines drawn through it. As you can see, by carefully picking the period, I can really change the story.
Of course charts can be helpful. Below is Chart E, the one I like. It covers the whole 14 year period, but it is a logarithmic chart and of a useful scale.

This is a much more representative chart. The period is long enough to be meaningful, the scale is such that you can see what happened and the later ups and downs can more easily be compared to the earlier ones. You might say that it shows a pretty good long term trend where losses happen but are made back and then new gains are made. You could also say "you can run, but you cannot hide." That is to say, the overall trend is good but while the volatility is not distorted to look greater than it is, it is also there and clear to see.
Charts and graphs are used in many disciplines and are a valuable tool that helps us to interpret data. I use them all the time. However, whenever you look at one, whether it is financial, statistical, a voter poll, weather, climate or anything else for that matter, you need to look at it with a degree of skepticisms. What are the scales, should it be logarithmic, what is the range, what is the margin of error, are you looking at the right or relevant information, how can this be misleading and finally, of course, how can this be helpful in decision making while not being misleading.
Return to top of page.
Return to Financial Insight's main page.
![]()
Published: January 2001, March 2003, Mid 2012
Note: This article was written several years ago before TFSA's became available. While it has been modified to reference TFSA's, it is mainly about RRSP's even though both have similar sheltering benefits.
Why RRSP's Work
It seems that every so often there has to be some discussion on the benefits of RRSP's. Someone will question if equity investments even belong in RRSP's since the tax on Capital Gains is much lower than on normal income. Their premise is that since capital gains are only one half taxed, it may make more sense to leave the investments outside of the RRSP. After all, withdrawals are fully taxed, so you lose some of the benefit that is afforded capital gains. We must admit, a few years ago when the rates were dropped back to 50% of the normal rate, we had our questions too, so we did do some analysis.
On the outside, many of the arguments sound good. However, as is often the case, these discussions fail to grasp the complete picture, so we ran some numbers. We figured that there was some basis to the argument that since the money in the shelter would be fully taxed when it was withdrawn; maybe it should be left outside. Actually, we assumed, wrongly assumed, that it would take some time for the benefits of sheltering to outweigh the benefits of the lower tax rate. What we found was that the advantages of the shelter took effect as soon as there was any, we stress any, realized return on investment. We had to give that some thought, but once we remembered that RRSP's are bought with before tax dollars where other investments are bought with after tax dollars, the answer became clear.
Since the money is going to be fully taxed anyway, either when earned or when withdrawn from the RRSP, it is what happens in the middle that counts. Since the RRSP shelters the income in the middle, it is better. Let us explain.
One of the first things that is often forgotten is that a rear-end load on the final balance has exactly the same effect as an equivalent front-end load on the original balance. For example, say you were investing $1,000 in an investment that would double in five years, and you had a choice of either a 10% front-end or a 10% rear end load. It would not make any difference which option you chose. With a front-end load you would get an original net investment of $900, once it doubles you have $1,800. With the rear-end load you start with the whole $1,000, once it doubles you have $2,000 then you pay the 10% rear-end load of $200 and you have the same $1,800 left over. In this way, RRSP's and TFSA's provide similar tax advantages.
The same principle applies to RRSP's. Outside an RRSP your original income, which is how you got the money to invest in the first place, is fully taxed at the beginning, like a front-end-load. However, if you put the money into an RRSP, the tax effectively becomes rear-end loaded instead. As we showed above, there is not really any difference in the end. However, with the shelter, in a way, the income in the middle is not taxed. Let us give you an example.
Say you are in a 40% marginal tax bracket, and for simplicity sake (and lack of a better assumption) you will always be in a 40% marginal tax bracket. This means that every additional dollar you earn is subject to 40% or 40 cents in taxes. Now lets assume that your employer gives you a $1,000 bonus that you plan to invest either inside or outside of your RRSP at a rate of 10%.
If you put the money into an RRSP, you can invest it all, as it will not be taxed. Also inside the RRSP the income is not taxed either. So at the end of 10 years you will have $2,594. If you then withdraw the money, you will pay 40% taxes on the balance and have $1,556 left over. Or you can invest outside of the RRSP.
In this case, the original tax is front-end loaded instead. That is you receive $1,000 but must immediately pay $400 in taxes. So now you have $600 to invest. Of course this is not a problem, since there will not be a rear-end tax, and we have shown that the effect of a front-end load or tax is the same as the rear-end load or tax. Except for one thing, outside the RRSP, the income is also taxed as it is earned. This means that if in the first year you make 10% or $60 ($600X10%), the government gets $24 of it and you keep $36. So your after tax return is only 6%. At 6%, in ten years your investment is worth $1,075. True there are no more taxes, but the $1,556 (calculated above) that you are left with after withdrawing from the RRSP is significantly better than the $1,075 you get to keep if the money is outside your RRSP. The difference is because in a way, inside the RRSP the investment income was tax free, as you really only got taxed on the original investment (albeit, on the final balance instead of the original balance). Of course the difference is less if you invest in investments that earn capital gains instead.
If you had invested in stocks that only returned capital gains, (no dividends), then outside the RRSP only 50% of the gains would be taxed, meaning an effective tax rate of 20% in the example. Also, the tax would only be due once the gains were actually realized. So if in the example you held the stocks for 10 years, then there would be no advantage to the RRSP. However, if every year you realized the return (presumably because you flipped the stock) then the RRSP has an advantage. In that case, your return would be reduced to 8% (10% less 20% of the return for taxes) and at the end of ten years you would have $1,295. Still significantly below the $1,556 you would have kept by using the RRSP. While we agree that you are not likely to flip the whole portfolio every year, especially if you follow our advise, it stands to reason that from time to time you will be flipping some investments and eventually you will probably be realizing most of an average years return every year. For example, if you turn over 20% per year, that suggest that every 5 years you will flip the equivalent of the entire portfolio, and after 5 years each year's realized income, which will be taxed, will equal one average years income. Regardless, while the difference may be less than what we are showing, the advantage of the RRSP is still there and is still significant.
It is worth noting that while the calculation is different for TFSA's the results would be the same.
It seems fairly obvious from the above that we should use RRSP's and TFSA's as much as possible.
The following table shows the difference in the value of a $1,000, 4% interest bearing investment after all taxes after 1, 5, 10, 20, and 25 years assuming a 40% marginal tax rate. Remember, outside the RRSP the money was taxed when it was earned, so you would only have $600 to invest to start with.
Description |
Value After 1 Yr. |
Value After 5 Yrs. |
Value After 10 Yrs. |
Value After 20 Yrs. |
Value After 25 Years |
| Inside RRSP | $624 | $730 | $888 | $1,315 | $1,600 |
| Outside RRSP | 614 | 676 | 761 | 964 | 1,086 |
| RRSP Advantage | 1.6% | 8.0% | 16.7% | 36.4% | 47.3% |
The following table shows the difference in the value of a $1,000, 10% capital gains type of investment after all taxes after 1, 5, 10, 20, and 25 years assuming a 40% marginal tax rate resulting in 20% taxes on the Capital Gains. Again, remember outside the RRSP the money was taxed when it was earned, so you would only have $600 to invest to start with.
Description |
Value After 1 Yr. |
Value After 5 Yrs. |
Value After 10 Yrs. |
Value After 20 Yrs. |
Value After 25 Years |
| Inside RRSP | $660 | $966 | $1,556 | $4,036 | $6,501 |
| Outside RRSP | 648 | 882 | 1,295 | 2,797 | 4,109 |
| RRSP Advantage | 1.9% | 9.5% | 20.2% | 44.3% | 58.2% |
As you can see, even after a year there is an advantage to the RRSP. There are cases where you do not want to use an RRSP however, but you should examine them carefully before you decide.
One reason is because you expect your tax rate to go up in which case a TFSA might be a better choice. In an RRSP this is a risk, although maybe less than it used to be. However, unless you expect a pretty significant increase and do not expect to leave the money invested for a long time, we think that the value of the shelter will probably more than make up for any difference. So do some analysis. The investment may be of a short-term nature, as you have plans for it. In this case the money should be kept outside of your RRSP's but it might be worthwhile to put that money in a TFSA if you have room. You may have investments that do not qualify. Obviously these investments must be held outside your RRSP's. Another reason is because you want to keep your high-risk investments out of your RRSP's. This makes sense, as it is wise not to gamble with your retirement funds. On the other hand, if you hold these investments anyway and you have additional room to put them into your RRSP, then it might be a good idea. It could be argued that if they go bad then you lose the ability to deduct the loss. However, we note that until you take the money out, it is in fact 100% written off inside the RRSP, which beats only being able to deduct 50% of it from other capital gains. On the other hand, we would recommend that if there is any chance that this high-risk investment is using RRSP room that you might one day want for another investment, then it is probably best kept outside your RRSP, and you might be surprised at how much money you will have to contribute one day, especially after the mortgage is paid and the kids are gone. This leads us to the last reason that came to mind. No more RRSP room. If you are investing more than what you can contribute to an RRSP, (which we would encourage), than something will have to be outside of your RRSP's. And that leads us to the question of which investments to place inside your RRSP's.
Which Investments Go Into an RRSP?
There are continuing debates on this issue. As we have pointed out, it is usually wise to use the RRSP shelter as much as possible. However, if your investments are larger than what you can have in your RRSP's, then some will have to be outside. The goal is to have the most money after all taxes at the end of the day. Sort of like; “He who dies with the most toys wins.” There are two common positions on this. The first is that you should shelter the investments subject to the highest taxes first. For example, interest income is taxed at a higher rate than dividends and capital gains, so under this argument, you should put your investments that make interest income into your RRSP first. The other argument is that it is better to shelter your highest returns. Until recently, we mainly agreed with the second argument, as our analysis had shown that the value of the sheltering of the larger return outweighed the difference in the tax rates. This was assuming a long-term return of 10% on equities and 4% on fixed income securities plus the tax rate on equities was about 2/3's that of the rate on interest. We found that after about 20 years, the benefit on the equities was so good that the RRSP made sense even if there was not a deduction for the original contribution. However, with the tax inclusion rates of capital gains being lowered back to 50%, the balance has shifted.
The following table shows the value of two investments, added together, after 5, 10, 20, 25 and 30 years. In each case the investor invested $1,000 in stocks earning (and realizing) 10% capital gains per year and another $1,000 in an interest bearing investment returning 4% per year. The investor's marginal tax rate is 40%. In the first instance the stocks are in the RRSP while the interest investment are outside. In the second case, the interest investments are inside the RRSP's and the stocks are outside.
Description |
Value After 5 Yrs. |
Value After 10 Yrs. |
Value After 20 Yrs. |
Value After 25 Years |
Value After 30 Yr. |
| Stocks inside RRSP | $2,092 | $2,824 | $5,643 | $8,310 | $12,507 |
| Interest Security Inside RRSP | 2,199 | 3,047 | 5,976 | 8,448 | 12,009 |
As you can see, it takes almost 30 years before it is better to have the stocks inside the RRSP instead of the fixed income securities. Of course the changeover point changes depending on what assumptions you make regarding returns, tax rates, amount of dividend income, how much natural sheltering you get from a buy and hold strategy and so on. But it seems safe to say that it now takes some time before it is better to have the stocks inside the RRSP with the fixed income securities outside. Therefore, unless you expect to have the investments in your RRSP for over 30 years, it is probably best to but the fixed income, or interest bearing securities into your RRSP first then add the equities until your room is used up. These analysis also apply to TFSA's, so look at your whole mix.
Conclusion
Based on our analysis, there seems to be little doubt. Even with the lower capital gains rates, a Canadian investor should use RRSP's and TFSA's as much as possible. If their total investments are greater than the maximum that they can have inside their plans, then there are issues about which investments should be inside versus, which should be outside. However, it is clear that RRSP's still work, and even better than you might have thought.
Return to top of page.
Return to Financial Insight's main page.
![]()
Published: January 2009
The new Tax-Free Savings Account (TFSA) introduced in the 2008 federal budget and taking effect on January 2, 2009 are considered to be the most significant new savings vehicle in Canada since the introduction of the RRSP. This new vehicle offers an equal opportunity for tax sheltered savings to all adult Canadian's, regardless of income or age.
Details can be found on the Federal government web site at www.tfsa.fc.ca. Essentially they work as follows:
These new accounts should be a terrific savings vehicle and we expect that they will be used by many Canadians. How you use them will depend on your circumstances. Essentially they have the same real benefits of RRSP's but with added flexibility. See the article below about RRSP's that explains the benefit of sheltering. If you are a high income earner then you will likely want to contribute to RRSP's first and then put any amounts over your maximum RRSP contributions in a TFSA, or if you do not have extra funds you may put short term money in a TFSA instead of a regular savings account. If you cannot contribute to an RRSP (e.g. you are retired and over 71) then you might put some of your investments in a TFSA. If you expect to be in a higher income group when you retire, you might invest in a TFSA first, then into a RRSP. Many people will use the account as a good place to place savings that they want to keep available for future use. Especially in the first few years until they have built up contribution room. Of course there are many different situations and circumstances so you need to use the accounts in the way that works best for you.
We should point out a couple of other considerations. As with RRSP's, the quality and risk associated with your investments has nothing to do with the tax status, it is a result of the risk associated with the underlying investments. Also, it is worth verifying what service charges the financial institution in question will be assessing, especially while the amounts are smaller. There is no point in saving taxes only to have the savings eaten up by the financial institution. For example, $5,000 at 2.7% will earn $135 in the first year. If you are in a 40% tax bracket, the tax on that is $54. So in that specific situation if you are going to incur an extra $54 in service charges, then essentially the benefit of the shelter is lost. So, consider what the service charges will be.
Return to top of page.
Return to Financial Insight's main page.
![]()
Published: January 2004
What we are talking about is spin-offs. That is where a company takes a part of its business that is not as profitable or no longer fits into its strategic plan, turns it into a separate public company (if it is not already) and distributes the shares to the shareholders. There can be several formats for this: At one extreme there is the splitting of the company into two or more major parts (which is often a sound approach) where shareholders hold all the parts. The other extreme is splitting the company into two or more parts where insiders or majority shareholders get the good parts and the other shareholders get stuck with the rest (obviously a rare but very offensive occurrence). Then there is what we consider the more common action of spinning out a small part of the company as a separate company and distributing it to the shareholders. This last item is what we are going to discuss.
There is usually a logic to these spin offs. Normally the company has determined that a certain part of the business no longer meets its strategic objective, for whatever reasons. This may be because things have changed or because management made a mistake. To be honest, it does not matter; after all if management does not make mistakes, they are not doing their job. However, this section, division or whatever no longer belongs and it is fair for management to dispose of it. Usually this results in it being sold off in one form or another. However, sometimes management theorizes that the assets belong to the shareholders and it is only fair to give the assets to them and preferable without triggering a tax consequence. So they organize a spin-off and give the part being disposed off back to the shareholders in the form of shares of another company. Now this may be for selfish or for purely altruistic reasons but the end result is the same.
The shareholders are now holding a position of the original company (that is okay) and a small position of the new company that they likely never asked for nor especially wanted. It really does not matter what the size of their holdings are, if we assume that an individual had a reasonable position of the original company where the value of their shares was reasonable in relation to the rest of the portfolio, then chances are that relative to the rest of the portfolio, they have a tiny little holding of the spun-off company that they must deal with. We fail to see the benefit to the average shareholder in that. We believe that management has several better alternatives open to them.
The obvious solution is to simply sell the new company either through a share offering or though a private deal. If the spun-off company is to be a public company and management wants to give the shareholders an opportunity to buy the new company, then all that they need do is give them first crack at the offering. Once the spun-off company is sold, if it wants to benefit shareholders directly, it can issue a special dividend, or if it wants to avoid tax consequences to the shareholders use the money to repurchase shares, reduce debt or fund expansion, all of which are for the ultimate benefit of the shareholders and none of which will leave them holding a small position in a company that they never wanted anyway. While this complaint is valid, you might ask what you can do about it.
Unfortunately there is little a smaller shareholder can do about these spin-offs but they do have choices. First, we are starting to have an inclination towards selling or avoiding company's that are planning spin-offs. While we would not sell a favorite holding because of it, we did recently dispose of a company that we had become somewhat neutral on and where the sale freed up funds for purchases of some other companies that we liked better. We would not suggest that you sell a company because of a spin-off; however, it might be one of many factors that influence your decision. Another thing you can do if you hold a company that is planning a spin-off is if there is a shareholder vote, vote against it. Also, you can write to the company (probably addressed to either the Chairman of the Board, CEO, President, Investor Relations Department or all the above) and tell them that you do not approve of the spin-off. If you use a full service broker, complain to the broker, while they cannot do anything directly, if they are hearing a complaint from their clients, they may pass it on, and if the brokerage houses do not like an action, they can exert some pressure on companies that are considering spin-offs. Finally, talk to other investors and get them to complain to their brokers, acquaintances etc., because while one lone voice in the dark may not amount to much, the voice of many will eventually be heard.
Return to top of page.
Return to Financial Insight's main page.
![]()
Published: July 2003
No matter what company you are looking at, it is bound to have something wrong with it. This is something we are often reminded of when we mention some of our favorites. We say that we like a company and someone says the typical "Yes But?" They will bring up some negative issue and say how they are avoiding it because of this issue. The interesting thing is that about half the time it is something that we consider positive, as few things are crystal clear in business. The company might be criticized for taking a certain action. Of course, management thought this was a good thing to do, but obviously some investors disagreed. In these cases it is necessary to draw your own conclusion. We often find that we are in agreement with management. This might be because we are looking at a longer term than other investors, because we have a bias toward the company or maybe we just see it differently. Then again, sometimes we agree that it is a negative, or are not certain, but we realize that based on the big picture, the issue is not that important. Actually, believe it or not, these negatives often work to our advantage.
Sometimes these things have an adverse effect on the stock's current price. That is, the current price drops, often in an overreaction. When this happens, if we think the item is positive, or not really important from a big picture point of view, we may see it as an opportunity to increase our position, if our holdings are not to large in the first place. If we already have a significant position, then we may do nothing, and in the long run this temporary setback is just a fact of life, but not really important as we have no plans to sell in the immediate future. However, in one, five, ten or even more years from now, this item will be long forgotten and its impact negligible, if there is any impact at all. So the item worked for us or just did not really matter.
The point is, the above scenario is true of all good companies. No company is perfect. At any given time there is bound to be something wrong. Further, every good company has it ups and downs, so there will be times that a company gets beat up. This maybe a good thing as it provides buying opportunities. So our goal is to locate, buy and hold (for years, maybe decades) good companies. Not perfect ones, these do not exist, and if a company does appear to be perfect, well you might have to question that too. Then we build a well-diversified portfolio of these companies. We are human, and our information is not perfect, so sometimes we will be wrong. We will do our best to dump companies quickly when we determine that we were wrong and that the company is not of the quality that we once thought. But overall, with patience, in the long run, we should be right often enough to be rewarded with a respectable return. And that is a realistic goal.
Return to top of page.
Return to Financial Insight's main page.
![]()
Published: June 2000, March 2003
Deciding when to sell a stock is probably one of an investor's toughest decisions, and in our experience, the area where we are most likely to be wrong. When you consider that markets rise about seventy percent of the time, it seems likely that our sell decisions will be wrong more often than not. Taking that into account, it is easy to see why a buy and hold approach is usually the best. After all, if you buy quality, then it is fair to say that in the long run, most of your buy decisions will turn out to be good ones, while most of your sell decisions might turn out to be poor ones. Regardless, for every investor, there are bound to be times when they need to sell.
So how do you make those critical sell decisions? Do you follow a formula, stick to some fixed rules or use some other criteria. There are many theories, so finding an approach is not difficult. Then again, avoiding poor reasons is another matter. Below we have indicated some of the common reasons for selling and made comments on each. In our opinion, some are valid, some are not and some can be valid in certain circumstances.
Common Reasons to Sell:
Quality of the Company: The company no longer demonstrates the quality that you thought it had. This is probably the best reason to sell. Circumstances may have changed, or you may have realized that you made one of those inevitable mistakes. Regardless, once you realize that the quality is not there, it is time to cut your losses and move on.
Ideally, once you reach this realization, you should sell immediately. We must admit that we do not always do that ourselves. In some cases, by the time we realize that we were wrong (or maybe admit that we were wrong), the price has deteriorated so much that there is no longer any point to selling, as we would not realize much cash. In those cases, we are inclined to hang in there, as there is no longer much down side. If things turn around, then we are inclined to sell while the selling is good. However, usually when we change our mind, it is not after a price crash, so selling immediately is the best move.
Portfolio Clean Up: Sometimes we notice that over time we have accumulated a number of small holdings that are cluttering up the portfolio. The reasons for purchasing the stocks may have been valid, however, they may not be much more than clutter now. You might say that these are small holdings and why not let them ride. While this is true, they may also be diverting some attention that would be better spent elsewhere, and in that sense, they might be doing some harm. So it might be best to sell these stocks so that you can concentrate your efforts elsewhere. In this case, we would be inclined to revisit the stocks, reconsider why we purchased them in the first place, and then make a decision.
You like another company better: Another valid reason. Some selling is done to free up money so that we can buy other companies. In this case there are a couple of pitfalls to watch out for. First, remember to watch your mix. If you start selling companies in one sector to buy those in another, your portfolio might not be properly diversified across the different economic sectors, or geographically. So remember to pay attention to your overall mix. Second, while it makes sense to switch companies from time to time, remember that every time you do, there are costs. There are broker's commissions, losses from the difference in the bid and ask spread and lost opportunities from not giving an investment enough time to perform. So watch yourself to be sure that your switching (or trading), is to make minor adjustments from time to time and that it is not becoming a habit.
To rebalance your Portfolio:This is something that we all need to do from time to time. Within the stock portion of a portfolio, some stocks will significantly outperform the others. Also, within the whole portfolio, stocks will usually outperform your fixed income investments, which means that over time your portfolio is likely to become overweighed in stocks.
First there are the individual stocks that have grown to the point that you are overweighed in them. This can be tough; after all, one might argue that you should hang on to the best stocks. However, every company carries its own risks, which can cause it to suffer severe set backs or go out of business. So you should evaluate if you are overexposed in that stock. If you are, then it may be wise to reduce your holdings. When you are done, it may still be one of your largest holdings, but your balance will be better.
The other rebalancing has to do with reducing the proportion of stocks. Here, you will become aware that you are overweighed in stocks. At this point it makes sense to review your portfolio and select some stocks to either sell, or to trim. These rebalancing actions can be done slowly as opportunities present themselves.
Overvalued Stocks: You believe that the market has overvalued a stock for whatever reason. We would warn against selling a stock just because it seems to be overpriced. First, your valuation might be miscalculated for any number of reasons. Second, many of the best growth companies are overvalued all or most of the time, as they tend to be a little ahead of themselves. On the other hand, if you feel that a company is grossly overvalued, or are questioning its quality, then this might be another reason to sell the stock or reduce your holdings, but be sure to look at the whole story.
Your Cash flow: If you need cash, then you may have to review your portfolio and pick some stocks to sell or trim, to raise the cash. Obviously this is not what you want to do, but sometimes circumstances dictate. If possible, you should plan to have money out of the market well (preferably years) before you need it, so that you can slowly sell off stocks as opportunities arise.
To take profits: They say you cannot go wrong taking a profit. We are not sure who THEY are, but we must strongly disagree. Selling to take a profit may make your broker rich, but for you, it is more likely to create missed opportunities. Good solid companies with growing profits and share price, have a tendency to continue to grow. So if you sell after making a profit, you may be selling before the biggest gains are made. Also, once you sell the shares, you need to find somewhere to put the money. So if you are selling to take a profit, chances are you do not have a better place for that money. In which case, why were you selling?
You trade to a fixed formula: There are many formula's available to determine when to sell. One age old formula is to sell a stock after it goes up a fixed percent like 15% or down a fixed percent like 10%. Of course in a volatile market like today's, you are likely to sell most of your best stocks at a loss before they have a chance to go up, and you will never enjoy the real fruits of your best choices. Another formula used mainly for more speculative stocks, is to sell half of your shares after the stock doubles, this way you get your money out. While we agree that there may be some wisdom in getting some or all of your money out of your more speculative stocks, these should only make up a small part of your portfolio, and we think that formula's in general fail to realize the complexities of the world and consequently the complexity of the companies that you are investing in.
It hit a price target: This seems to be one of the more popular approaches. Setting price targets, then selling once the target is reached. Actually, we suspect that it is most popular with brokers, after all, once a target is hit, they get two commissions, one for selling then another for buying whatever you replace the old stock with. However, we see a lot of problems with price targets. First and most importantly, they assume a static world, but the world is anything but static. Also, they seem to oppose the buy and hold strategy that we continually recommend. Finally, once you sell, you have to find something to replace the stock with. If there is something better, then switch, do not wait for a target, and if there is not something better; then why did you sell the stock in the first place? Surely not so you could just buy it back, at what is likely to be a higher price. On the other hand, if you do not like the stock, then sell it; do not wait for a target that might never be reached.
Price Maximized: You think that your stock has gone as high as it is likely to go. Well okay, but why is it that you think it is unlikely to go any higher. Is it to do with the company's quality, or are you just market timing. We already addressed the quality issue, if the quality is not there then sell, however, if you are trying to time the market, chances are that eventually you will learn that the market is smarter than you. We can say categorically that the market is smarter than us. This should not come as a surprise as most of the most successful investors like Warren Buffet and Peter Lynch, to name a couple, continually stress that they cannot successfully time the market.
To time the market: Okay, we will say it again. If you are trying to time the market, chances are that eventually you will learn that the market is smarter than you. We can say categorically that the market is smarter than us.
To rotate to the next winner: This is another form of market timing. So our comments on the last two reasons apply here also.
To make your broker rich: This may not be as humorous as it sounds. While we believe that most brokers genuinely do look out for their clients best interest, there are some who are more interested in lining their pockets with commissions than in looking out for their clients best interest. While we cannot prove anything, during tax time, even during bull markets, in the tax part of our business, we do sometimes notice cases where the brokers seem to be making more on commissions than the clients on the investments. In these cases, you really have to wonder what is going on.
The Final Decision:
You may be wondering which approach to follow. However, we do not prescribe to any hard rules. Sometimes you will sell a stock for one of the above reasons, more often than not, it will be for a combination of reasons. The trick is to know what your reasons are and understand the difference between good and bad reasons. Then you should make the best decisions you can and move on, putting those decisions, some good and some not so good, behind you.
Return to top of page.
Return to Financial Insight's main page.
![]()
Published: October 2002
To answer these questions in order: Not necessarily, yes and yes. It is interesting how when markets are dropping people seem to be fixated with why they are still too high, and when prices are rising they are equally fixated with why they are still too low. We also note that the more fixated people are the more wrong they are, but enough of that, let us talk about the current market.
First we should mention that this is a discussion about prices in general as in every market there are companies that are over priced, companies that are under priced and companies that are reasonably priced. So what about today's prices? In both Canada and the United States, the markets have dropped around forty percent from peak to valley. Yet we continually hear about how based on earnings the markets are still high, as price earnings ratios (PE's) are still very high. Since the PE is calculated by dividing the share's price by its earnings per share, the higher the price in relation to earnings, the higher the PE. Since PE's are historically high, then so must be prices. This in itself brings up some interesting thoughts.
First, it is funny how when the markets were peaking no one seemed to care about earnings anymore. See Dave's Rule for more comments on this. We also believe that these concerns over high valuations are a bullish sign. Put another way, the more that people are worried that prices are too high, the more likely it is that they are actually too low. Something to do with the majority are usually wrong theory. Finally, we have noted that PE's are often excessively high just before a market run up. So let us discuss why this last peculiarity happens.
To some extent the markets mirror the economy. Actually, the longer the time period the more the correlation, as in the end, share prices will eventually reflect corporate earnings and corporate earnings will ultimately reflect the economy. That is, in general in a good economy earnings go up and in a recession earnings go down. Since earnings are what a company is in business to make, when earnings go up, ultimately so do stock prices, and when earnings drop so do stock prices. However, for a number of reasons, earnings will normally fluctuate a lot more than either the markets or the economy. Consequently, when stock prices are depressed, often corporate earnings are more depressed, resulting in rising PE's in a dropping market. This leaves the inevitable situation where people are nervous since the market is dropping and PE's are rising. As time goes on and the exaggeration increases, they get more nervous and often bail at the market bottom; then the cycle reverses.
As the economy improves so too do earnings and usually at a greater rate then either the economy or stock prices. After all, they have some catching up to do. As a result, PE's start to fall, even though prices are rising. This situation of depressed earnings is where we believe we are now. It is our expectation that when the economy rebounds, earnings will also rise but at a faster rate than either the economy or the markets. This is one of the two reasons why the current historically high PE's do not worry us.
The other reason is low interest rates. Return requirements on stocks are directly effected by the return on fixed income investments like government bonds. Investors will ultimately require a higher return on stocks than on more secure investments like government or corporate bonds. After all, why take the added risk if you do not expect a higher reward. Over the past few decades' investors have generally expected PE ratios of between 10 and 20. However, over this time period interest rates have been historically high. In recent years interest rates have dropped back to more historic rates where government bonds are only yielding returns of around 5 percent or less, and odds are these returns will not change significantly for some time. Since an investor cannot look for as high of returns from bonds, it stands to reason that they will not demand as high of returns on stocks as they had either. As a result PE's will likely be higher for some time to come.
So are prices too high? In general, not necessarily as earnings are probably somewhat depressed due to the current economy and PE's will likely be higher than they have been during the last few decades as interest rates and inflation stay in check.
Return to top of page.
Return to Financial Insight's main page.
![]()
Published: January 1995, January, 1996, September 1997, September 1998, September 1999, October 2001, October 2002, September 2009
As summer comes to a close and the fall leaves start to appear, it seems like a logical time to review your financial affairs. The first part of that is to review your asset mix and make sure it is still suited to your specific circumstances. To help you do this we try to reprint the following article once a year. We know that some of you have read it before, but we urge you to read it again, as this issue really should be revisited annually.
Balance, or asset mix, is probably the most important factor affecting your investments. Simply stated, it is the amount or percentage of your investments allocated to each type of investment. For example, an investor may have 40% of their investments in very safe investments like Treasury Bills, 10% in Medium safety investments like Corporate Bonds, 40% in equities and 10% in Speculative investments like an emerging market fund.
Getting the right mix is very important, but it is not always easy. The mix should consider all your personal circumstances and your personality.
Many planners have tried to simplify the task by creating canned approaches. Some are forms of market timing, others rely on formulas and still others rely on predetermined balances which seem to assume that everyone is the same.
One common formula is to deduct your age from 90, and the result is the percentage that should be in equities. Another recommends investing enough in fixed income investments to generate the income you need to live off, then putting the balance in equities. The problem is that these approaches assume everyone is the same. They do not consider your personality, risk tolerance, or even your long term needs.
Another approach is to time the markets. We have noticed that various timing services seem to keep cropping up. There is little question that successful market timing can provide terrific results. The problem is that these approaches have a way of letting us down when we need them most, and even if they do not, are you prepared to trust your future to short term market projections.
This leads us back to IFC Investment Principle number one; Balance your investments according to your personal circumstances. These other approaches may make your job or your financial planner's job easier, but they avoid tackling your most important financial decisions.
Two Kinds Of Risk
Before we go on we should discuss risk. When you are determining your balance you must consider the risk of the different investments. However, before you do, it is important to understand that for investors there are two types of risk. There is the risk of losing capital and of not having enough.
Most people are familiar with the risk of losing capital. It is what stops us from putting all our investments in speculative investments.
The other gets less consideration, but it may be the bigger risk. That is, the risk of not having enough money to live on, at an age when going back to work is not an option.
This leads us to the risk/reward equation. The main objective of balancing your portfolio is to find a mix that provides a reasonable return, and an acceptable level of risk.
Types Of Investments
Now that we have discussed risk, we are ready to look at the basic investment categories, their historic returns and their relative risk.
Very Safe Investments; These include investments such as deposit accounts, term deposits, guaranteed investment certificates, treasury bills, short term government bonds and short term government money market instruments. Over the long run they normally have the lowest return. Considering recent history, it is probably reasonable to expect long term returns close to the rate of inflation and one and one half times the rate of inflation.
Safe Investments; These include investments such as high quality short and medium term bonds, money market instruments, and mortgage instruments. While not as safe as the very safe investments, these are still considered very low risk. Generally when they show a loss it is small, temporary, and only a reflection of market conditions, not a weakness in the underlying security. These types of investments usually have long term returns that are slightly higher than the very safe investments.
Medium Safety Investments; These include investments such as long term government bonds, corporate bonds and bond funds. These investments are much more risky than either of the above two groups, although their greatest risk is market risk. While these investments can significantly out-perform or under-perform other investments, historically they perform only slightly better than the safe investments.
Equity Investments; These include investments in shares of companies. While they are considered riskier than any of the above investments, over the long term, they have shown the best results. Historically, the long term total returns of Canadian and U.S. equities have been over two to three times the rate of inflation.
Home Ownership; Most people greatly exaggerate the returns they earn on their principle residence. This is because they calculate the total growth in value and forget that it has happened over several years. Nonetheless, a house does provide an excellent hedge against inflation, a place to live (which saves you rent) and if it is your principal residence, any gains are tax free in Canada. In the long run, not many things can match the security of owning a home, once the mortgage is paid.
Now we can tackle some personal questions.
The Right Balance, A Personal Question
As we said earlier, obtaining a balance, or Asset mix that is right for you is probably the most important part of investing. This balance should not be influenced by the market. Once you have determined the mix, you should review it regularly, probably once a year, as times and circumstances change.
First you need to answer some personal questions.
1. What am I saving for?
2. What is my time horizon?
3. How much can I afford to lose?
4. Am I concerned about having enough?
5. How much risk am I comfortable with?
What am I saving for? Or what are your Goals? This will effect some of the other questions. Some common goals are; saving for the down payment on a house, your children’s education, a major purchase, to start a business, retirement, to supplement your income, and/or to generate an estate for your heirs.
Once you know your goals you are ready to answer the other questions.
What is my time horizon? How long do you expect to have the money invested? If your goal is a down payment on a house your horizon will probably be short. On the other hand, if it is for retirement, you might have a longer time horizon.
If your time horizon is short, say under ten years, you will need to concentrate on the lower return but safer investments. If it is longer, you can consider putting some money in the higher return but more risky investments.
How much can I afford to lose? We hate this question, but it helps to put things in perspective. Our circumstances and time horizons will play a major role here. While we do not want to lose anything, we can usually afford some losses. If you have a long time horizon or other income sources, you may be able to afford more risk.
The key question to ask yourself is what if you lose a substantial portion of your investments? Do you have time to rebuild or have other sources of income (e.g., salary or pension income). Consider your circumstances. The less you can afford to lose the more you should put in safe and very safe investments.
Am I concerned about having enough? This is a very important question. Playing it safe may be a route to the poor house. With the safer investments, after tax and inflation, it is very difficult to make money. So, living off the interest may not be an option. For many, their biggest fear should be running out of money.
How much risk am I comfortable with? A truly personal question. This is one of the main reasons that we do not like canned formulas. Two people in exactly the same circumstances should not necessarily make the same decisions. We are, after all, human. The amount of risk, not to mention volatility, you are comfortable with is a factor of your personality, experience, upbringing and exposure. You have to take a good look at yourself.
Sometimes we recommend that a client invest a lower percentage in equities than we feel is appropriate, because we know they are not comfortable with risk. However, as they gain experience, we are often able to increase the amount of equities to more appropriate levels. On the other hand, there are also those who cannot sleep at night if they do not have significant holdings in equities. They do not like knowing that their investments have little or no opportunity for real growth. You need to know yourself.
Selecting The Balance
Once you understand the different types of risk and different types of investments, and have asked yourself the above questions, you are ready to determine your investment balance. This can be done by investment category.
Very Safe and Safe Investments; For most people these should make up between 25% and 75% of their investments.
If you have a short time horizon, are concerned about loss of capital or are not comfortable with the volatility and risk of equities, then this group should make up a high percentage; closer to 75%.
If you have a longer time horizon, say ten or more years, you can afford some setbacks, and can live with some volatility and losses, then the amount invested in these types of investments can be lower.
Medium Safety Investments; For most people these should make up between 0% and 50% of all their investments.
Some people have had very good results in this area, especially in the last couple of decades. However, in our opinion, the historic returns do not justify large investments in this area. Also, these investments do best when interest rates are dropping. Not something that is likely to happen in a big way right now.
Equity Investments; For most people these should make up between 25% and 75% of their investments.
Historically they have the best returns, but they are also the most volatile. If you are looking for growth, this is the place to look. However, since it is the most volatile, all the money invested in this area must have a long time horizon. We prefer a minimum of ten years.
If liquidity is not important, you have a long time horizon, can afford setbacks, and you can live with the ups and downs, then the percentage in equities should be on the higher side. Also, if you are concerned about inflation or having enough money to retire on, a reasonable equity portion is necessary.
If you meet the criteria for a large equity portion, but lack experience with equities, you might want to lower the percentage until you have gained some experience and lived through some market setbacks.
Some Final Thoughts On Equities; Diversify, diversify, diversify, otherwise you leave yourself open to holding one big loser. The idea is to have a healthy mix where in the long run the winners will more than make up for the losers.
International Equities; We recommend you place at least 30% of your equities in companies that do business around the world. This will provide exposure outside Canada and further spread your risk.
Conclusion
Selecting the proper balance is one of the most important parts of investing. You need to review your personal circumstances, the types of investments, and then select a mix that is suitable for you.
Return to top of page.
Return to Financial Insight's main page.
![]()
Published: July 2002
OKAY, we have heard enough of this "things are different now and you need to trade to make money in this market"…. crap. This is pure bunk. You need to trade if your goal is to make money for your broker, but in our opinion that is the most positive effect you are likely to achieve. If your broker tells you this, FIND ANOTHER BROKER. If your portfolio manager or fund manager says this, FIND ANOTHER MANAGER. If your advisor tells you this, FIND ANOTHER ADVISOR. If you hear this in locker rooms or chat rooms and you pay attention, then you deserve what is coming to you for being foolish enough to listen to anything you hear in either locker or chat rooms.
Do we sound a little fed up? Well you are dammed right we are, and this crap is just going to far. In 1999 they said you had to buy technology, ignore profits and all the old rules because everything has changed. We continued to warn our readers that nothing had changed, but who listened? Now we are hearing the line that in this flat market, you need to trade as things have changed. Well we are here to tell you again that nothing has changed; the old principles and rules are as true now as they have ever been. If you doubt us even a little, then it is time to take this link and read or reread our January 2000 issue of Financial Insight.
In the long run, and investors should be long run thinkers, sound companies, with good profit histories, good potential and good management will grow, prosper and reward their owners. As long as this is the case, they will continue to prosper and grow, so there is little need to sell them. Yes the ride will be a bumpy one, but the trend will be up. If your portfolio is made up of this kind of company, most of your holdings will eventually reward you. Different companies will reward you at different times but over the long term (5 to 10 years) most of them should pay off. Then there is the bonus, as long as most them are still good companies they will continue to grow over the long term, so you will probably want to keep most of them and only sell when the circumstances or your opinion of a company changes or when one has done so well that it makes up a disproportionate amount of your portfolio, in which case you might wish to reduce your holdings.
You can make a lot of money trading if you get it right, or lose a lot if you get it wrong. It is our view that it is a lot easier to select good companies and build a solid portfolio then to second guess the temporary moods of the market. You will still make mistakes, but chances are that in the long run you will make more right decisions and those right decisions will more than make up for the mistakes. It might not be exciting, it will not make your broker rich and you will not be the most interesting person in the locker room, but in the long run you might turn out to be the most successful investor. So what is your goal, short run glory or a sound long-term overall return?
Return to top of page.
Return to Financial Insight's main page.
![]()
Published: July 2002
The price earnings ratio, (often referred to as PE), is a company's share price divided by its earnings per share. This is a very popular and useful tool for measuring value or share price. The higher the PE the higher the share price is in relation to earnings and the more likely that the price is overvalued. Unfortunately, what is often forgotten is that the ratio is a factor of both share price and earnings.
As long as the earnings number being used is reasonable, then the PE is likely a fairly good measure of share price. The problem is that in the short run, even for the best companies earnings sometimes fluctuate from the overall trend. These fluctuations can be a result of many things, but one time items and economic factors are among the most common problems, and while they can and often do effect current earnings to a much greater effect than the market effects share price, they may not be very relevant to the company's long term financial health and therefore its real worth. Let us explore an example.
Let us say that company "A" has been growing its earnings at 10% per year fairly consistently for several years, that we would normally expect a PE of 10 for the company and that all things being equal this years earnings should be $1.00 per share. Then a reasonable share price would be $10.00. The PE of 10 times the earnings per share of $1.00. So let us assume that the price is 10.00 and everything is fine. But what if the company had a fire so its plants were closed for nearly half the year. We will also say that insurance paid to restore the plant and now everything is running smoothly again, and that chances are that in a year or two earnings should be back on the old track. In this case $10.00 is still a fair share price. However, for a year or two, earnings were cut in half due to lost sales (not covered by insurance) because of the fire. So current earnings are only $0.50 per share. So at $10.00 the PE is now 20 times, twice the expected PE for the company. Thus, according to the PE ratio, at $10.00 the share price is way to high. More likely, because of the situation, the share price would drop. Let us assume it dropped to $7.00. From a long run point of view, this is a very attractive price, and if it were not for the fire there would be a very attractive PE of 7. However, if you do not look carefully at earnings, you will see a PE of 14. Seven dollars divided by the current real earnings of $0.50. In this case you might find yourself selling when the price is at its lowest rather than taking advantage of a buying opportunity.
Other similar examples could include temporary earnings reductions due to economic factors, restructuring costs, a slowdown due to plant restructuring, one time write downs or any number of things. Alternatively, one time opportunities might cause a company's earnings to be over inflated one year, which could distort the PE by making it lower than it would be, had you removed the one time factor.
So while we often look at PE's to value stocks, and markets for that matter, it is important to understand the make up of those earnings. Sometimes, due to the higher fluctuations in earnings, you may not be aware that a high PE is actually an indication of a low price rather than the normal situation that is the opposite. This is especially true in the case of valuing markets during times of recession. So before you jump to any conclusions based on PE's, make sure you know what makes up the earnings number.
Return to top of page.
Return to Financial Insight's main page.
![]()
Published: March 1997, April 1998, March 2002
Note: The following article applies to Canada, but investors in any country should consider the principles. While the conclusions may differ in different countries, you should still consider them in your investment strategy.
Our standing advice is to place about thirty percent of your investments in international investments. For the equity portion of your portfolio, this can be a portfolio of shares from all over the world, a portfolio of North American companies that do business around the world, or a mix. Of course the shares can be held individually, in mutual funds or in both. This advice is meant to reduce risk by spreading it over several economies. The problem comes when people invest too much outside their own country.
With a federal debt of almost 600 billion dollars (about $20,000 per person), massive provincial debts, a federal pension scheme that may or may not prove to be sustainable, an unsustainable health care system that many seem bent on maintaining, and in reality, a one party federal so called democratic system, it becomes easy to see why the Canadian dollar is continually eroding and why many investors wish to hold a large portion of their investments outside Canada.
If Canada does not get its act together, these foreign investments will pay off. They will provide increased stability and when converted to Canadian dollars, their value will be even greater. Actually, this is a main reason why we recommend some foreign content.
But what if they are wrong? Maybe they are taking a good thing too far. Few of these investors plan to leave Canada, so their welfare is connected to it, and they will ultimately need Canadian currency.
When you think about it, putting most of your investments outside Canada is a bet against the Canadian dollar. If your returns are good and the dollar goes down, you get a double pay off. However, if the dollar improves by ten percent (ten percent equals about six cents) the value of your investments will drop about nine percent. Your foreign growth could actually be eroded by exchange losses. Many people doubt this will happen, and while we will agree that there is a significant chance that it will not happen, we also think that it is entirely possible that it will happen.
While there are serious concerns, there are also reasons to be bullish about Canada in the long run. Compared to the American currency, the Canadian dollar is historically low. As the different economies all over the world gain momentum, especially the third world economies, we believe that Canadian expertise, knowledge and resources will be called upon. As a result of the war on terrorism, it appears, as we suspected it would, that Canada's ties with the United States will ultimately strengthen, promoting increased trade. For some time now Canada has had a trade surplus, which will ultimately mean increased demand for our currency. While there is a huge amount of government debt, the federal government has managed to get into a surplus position and is starting to reduce its debt. Also, most provinces have stopped running deficits and one may even eliminate its debt in this decade. We shall see if the Canada Pension Plan is sustainable, but at least there is now a plan and plans can be modified. As for health care, emotions run deep, however, in the end practicalities will force us to figure out what needs to be done and to make the necessary changes, whether we like them or not.
So while there is cause for concern about the Canadian economy and our currency, there is also a lot of reason to be optimistic. What this means is that we need to manage our investments for either eventuality. The best way to do this is to have a reasonable portion of our investments in foreign investments, but not to overdue it. This way if Canada does poorly, we will have some foreign coverage to protect us. If we hold our own, then the foreign content will not hurt either and if Canada does flourish, well since most of our investments are in Canada, we are bound to prosper as well. Now that is reasonable diversification, in all its glory.
Return to top of page.
Return to Financial Insight's main page.
![]()
Published: March 2003
First let us set the record straight. The Enron case is nothing new, different or unusual. In fact, you can predict a similar story will happen again in three or four years, then again in another three or four years, then again in another ....... well you get the picture. What should be surprising (should be but is not) is how it is always treated like a surprise and as if because of this amazing story, everything has changed. Automatically names like Dome, Principle Trust, Bre-X and Long Term Capital come to mind. The fact is that every few years a major hot stock crumbles. While we can learn some lessons from each, and each one will influence future investing in its own way, these stories are to be expected in any free enterprise system. But we should also remember, they are the exception, not the rule.
Obviously, it is in our interest to avoid these catastrophes, so rather than lose sleep over what has happened, or what will happen, we should concentrate on how to avoid having them happen to us. Following are some things to watch out for when you are picking stocks. Be careful though, there are no hard and fast rules. It is important to look at the whole picture and put any warning signs in perspective. We expect that most of the best companies will appear to exhibit some warning signs from time to time, and depending on the circumstances, the same sign may be a positive factor in one case and a negative in another. Now that we have shattered your confidence, we should bring up the most important safeguard.
Your best defense is always to build a solid well-diversified portfolio of high quality stocks. It may be true that the more stocks you hold the more likely you are to own the next Enron, however, by concentrating on quality we reduce our risk and by being satisfactory diversified (but not necessarily over diversified) we limit the damage that can be done by any one stock, sector or region. We also increase the odds that our winners will more than make up for our mistakes, and rest assured, there will be mistakes.
So here are some things to consider when selecting stocks:
Return to top of page.
Return to Financial Insight's main page.
![]()
Published: April 1998, October 1998, January 2002
Derivatives can mean a lot of things, but here we are referring to options and futures contracts. Essentially, an option is an agreement where one party gets a fee to agree that up until a certain date, the other party can purchase from them (a call option) or sell to them (a put option) a specific security for a predetermined price. Essentially, a futures contract is where two parties agree that one will sell a given security or commodity to the other party at a specific date for a specific price.
Options: In the case of an option one party is speculating that the price will not be reached while the other is speculating that it will be. Many small investors use this as a method of leveraging a small amount of money. They will buy a call option for a small fee. If the price goes up they can either sell the option for a profit or call the option and immediately sell the security without putting up the full amount themselves. Since the option fee is a fraction of the cost of the security, they stand to make a very good return on their investment. Of course if the price is not met, they lose the whole investment. A put works in reverse, they hope the price will drop so they can buy it for less and immediately sell it to the seller (writer) of the put option.
The person selling the option is often a larger investor who is also speculating. They are gambling that they will get the fee but the option will not be exercised. If they are right, and they usually are (we have heard that as many as ninety percent of options do not get exercised), they make a tidy little profit. If it is a call option and they already own the stock, then there is little risk. Except that if they are forced to sell a good stock, they could lose a substantial amount of growth if the market goes up quickly.
The above is how investors speculate using options, something we do not advocate, as in the long run, the real winners are usually the brokers, not the investors. However, options can be used as a hedge to reduce your risk. Say for example, you knew that you were going to receive a security in the future, but you were concerned that the price might drop before then. You might buy a put option. Then you would know that if the price dropped, you could still sell the security at the put price. In this case, for a small fee you have removed the risk of seeing a large drop in price before you take delivery. On the other hand, if you were expecting a large sum of cash in the future, but were concerned that the price of a security you want might go up before you have the money, you could remove the risk by buying a call option. Then if prices rise before you get the money, you know that you can still buy the securities for the predetermined price.
Futures: Futures are sometimes used by investors to speculate on the direction of a currency or commodity. If they are right, the rewards can be great, however, if they are wrong the losses can also be great. In this case they are speculating on which way the market will go over a given period of time. As with options, futures can be used to reduce risk. Companies that do business internationally often use them this way. For example, a company may sign a large contract for which they will be paid in a foreign currency. Since they will receive payment in the foreign currency, they have a foreign currency risk. To reduce this risk they might sign a futures contract to sell the currency at a predetermined price for their domestic currency. Or maybe another company signed a contract to purchase materials and pay in a foreign currency. They also have a foreign currency risk, except in the opposite direction. To reduce the risk they might sign a futures contract to purchase the foreign currency. This way they know in advance what their cost will be in their domestic currency. In both these cases the companies used the futures contract to hedge or reduce their risk, as opposed to speculating.
As you can see, derivatives can be used to speculate, but they can also be used as a hedge. Our advice is that they should only be used as a hedge, which is what they were originally designed for.
Return to top of page.
Return to Financial Insight's main page.
![]()
Published: November 1999, December 2000, July 2001
Let us assume that you have some money set aside and are ready to start your stock portfolio. Now you must begin the task of selecting your first stocks. Presumably, you will have money to add to this portfolio from time to time (preferably on a regular basis), so over time, you will be adding stocks as well.
The obvious question is where to start. This is where many people go wrong. The inclination tends to be to start with hot speculative stocks or new issues. However, at this stage, that is exactly what you should be avoiding. Your portfolio should be founded on a number of high quality conservative stocks, then once you have established this base, you can add some of the more speculative and more exciting stocks. Then when things go wrong, or you make some of the inevitable mistakes that all investors make, it will not hurt very much, but when you are right, the payoff will be an added boost.
First, we should discuss stock ratings and economic sectors. There are a lot of services that cover a number of stocks and grade them as well as give advice. These are very good for helping you find and select good stocks. Whichever ones you choose make sure that they follow a philosophy that suits your needs, and we recommend avoiding the ones that concentrate on trendy or hot stocks. For Canadians, there are two organizations that we particularly like. One is Pat McKeough's organization and the other is MPL Communications Inc. (see our Interesting Web Sites section below for links to their web sites). Following the MPL approach, we classify stocks as Very Conservative, Conservative, Average, Higher Risk and Speculative. We also place each stock that we follow into one of the following six economic sectors; Finance, Utilities, Consumer, Resource, Manufacturing and Multi-Sector for companies that fit into more than one of the first five sectors.
The long-term goal is to have a good base of Conservative and Very Conservative stocks with some others in the lower categories to round things out. How much to have in each category is a personal preference, but generally speaking, we would recommend that at least fifty percent of your stocks be in the Conservative and Very Conservative categories. We should also note that while we hold average, higher risk and speculative stocks, we normally only buy high quality companies, or at least companies that we consider to be high quality. Remember, a company is often more speculative because of its size, age, industry or whatever, not because of its quality. The other goal is to have a reasonable spread between the different industry groups, and some geographical diversification.
When starting your portfolio, we recommend that you buy two or three stocks. These should all be either Conservative or Very Conservative and be either Multi-Sector stocks or in different sectors from each other. Then, over time add some more conservative and very conservative stocks in different sectors. As you select stocks, always consider their impact on the total portfolio. Do they provide good diversification? Are you getting some geographical diversification?
Once you have five to ten stocks, you should have a good base to build from. Then over time you can add stocks that are more speculative in nature, as well as more conservative stocks and you can increase your holdings of the companies you already own. With each investment, you should consider the overall impact on the portfolio and you should stick to high quality companies. This approach will ensure that you have a high quality well-diversified portfolio that suits your needs, allows you to ride out the bad times and prosper in the good ones.
Return to top of page.
Return to Financial Insight's main page.
![]()
Published: February 2000, May 2001
It seems that lately leases (mainly automobile leases) are all the rage. It used to be that only businesses leased automobiles, now lured by lower payments, easier credit and a number of other things, more and more consumers are leasing rather than paying cash or borrowing directly. Some statistics indicate that over fifty percent of new cars purchased today are leased rather than owned. So what about this bug, is a lease really good for you, or is it merely hype?
First let us examine the three main options.
The first option is to purchase using your own cash without any financing. Clearly, in nearly every case, if you can afford it, this is the best option. Yes we know there are discussions about investing your money and in some cases the deductibility of interest. So let us comment on that. Simply put, for an individual (not a business), unless you can invest the money for a higher after tax return than the after tax cost of borrowing, it is better to use your own money. If you can invest at a higher return, you still want to be sure you are borrowing where you can get the lowest true after tax borrowing cost, which most likely will be to borrow directly for the investments. For a business, the decision is a little different, chances are it will be borrowing anyway, so in that case, the objective is to borrow where you get the lowest true after tax borrowing cost, which may or may not be for the vehicle. Regardless, whenever you can, you should avoid financing, as using your own money is usually the better choice.
The other options are the financing options. Do you borrow directly, usually from a bank or do you lease. Truly there are advantages to each, and doing an analysis is often difficult because of the complexities of most leases, which by itself should tell you something. So let us examine the issues:
First we will discuss the main advantages of borrowing and then purchasing the vehicle. The main advantage is that it is usually a cleaner, if not cheaper process. You own the vehicle; there is no fine print and no special circumstances. A term loan from a Canadian Chartered bank is very clean. You know what you have and there is little or no fine print. If you want to pay something early it goes directly against the principle, which reduces the interest cost, as you now owe less. The main negative is that it may be harder to be approved. However, borrowing from a bank is normally our preferred method of financing, it is cleaner, there is less fine print and in the end it is usually cheaper, although that is not what the leasing companies would have you believe.
Now we will examine some the advantages that we have heard of for leasing. Some are valid, and some are debatable.
Lease Company position: If you spend the entire amount up front, you will not have any money available for emergencies. Our Reply: This is true of any expenditure, even groceries. This is why you should plan your finances and only buy what you can afford; it is not a reason to pay more for financing. Although we will concede that for most people, they are going to have to finance their vehicles, unfortunately.
Lease Company position: Leasing has a lower initial outlay than a loan. With a good credit rating, all that is required is the first payment and a security deposit. Our Reply: This is only partly true, with a bank loan the first payment will not be due for a month, all you have to pay is what is not financed, which believe it or not can be zero if you have a good credit rating. So it may depend on your circumstances. Either way, this really should not be a deciding factor.
Lease Company position: A lease can be written off faster for taxes as the whole payment is deductible while with a loan only the interest part of the payment is deductible. Our Reply: This is probably the most common misconception about leases. While it is true that the lease payments are greater than the interest costs, this statement does not present the whole story. In a case where you can deduct your automobile costs, if you borrowed to buy the vehicle instead, then you would own the vehicle, and as well as taking interest expense on the loan, you could also depreciate the vehicle. In Canada we do this using Capital Cost Allowance (CCA), which is a declining balance method of depreciation. For example if it was a $20,000 vehicle, you could deduct 30% of the declining balance every year except the first when you can only take one half the normal depreciation. So, for the year of the purchase you would get to deduct ½ of 30% of $20,000 or $3,000 plus of course any interest on the loan. Three thousand dollars divided by 12 equals $250 which is about what the monthly lease payments would be, so your deduction in the first year is about the same. However, in the second year, you can deduct 30% of the new balance of (20,000-3,000) $17,000. This equals $5,100. So you would get to deduct $5,100 plus any loan interest. This $5,100 is considerably more than the years lease payments would be. As you can see, contrary to common believe, the tax write off is much faster when you purchase the vehicle than when you lease.
Lease Company position: With a loan obligation you pay for the whole car while for a lease you only pay for what you use. Our Reply: This has got to be the most absurd thing we have ever heard. We would be reluctant to do business with anyone making a claim like this. Who do they suppose is paying; after all leasing companies are in business to make a profit. The difference is that with a loan, once it is paid, you own an asset and no more payments are required. At the end of the lease you have nothing, so you just keep paying and paying.
Lease Company position: With a lease you will generally have a much lower payment. Our Reply: It depends on the term of the loan. If you take a two year loan versus a two year lease, the payments for the lease will probably be lower. This is because with the lease, after two years you will have nothing to show for the payments, you just helped the leasing company pay for their car, not yours. With the loan, after two years you own the vehicle free and clear, no more payments to make. However, if the loan payments are too high, you can stretch out the term. Chances are you will find that the payments for a five-year loan will be about equal to those of a two-year lease. Be sure to compare apples to apples.
To get a fair comparison, negotiate the purchase first, as if you are going to pay cash. Then once the price is set, find out what the terms of the lease would be. Then compare those to a bank loan. We had an opportunity to do a fair comparison a few years ago. We found out the terms for a two-year lease. Then we checked the terms at a major Canadian Chartered bank for a five-year term-loan. The payments were within one dollar of each other, but the amount to buy the vehicle at the end of the lease would have been over two thousand dollars more than the balance on the bank loan at the end of two years. Remember, on a term loan from a Canadian Chartered Bank, you can pay off the principle at any time without penalty. Try paying early for a lease and see what you get. So, with a fair comparison, in this case, after two years we were over $2,000 ahead with a bank loan.
Lease Company position: With a lease there are more options at the end as you can walk away, buy the vehicle for the buyout, extend the lease or if there is equity you can use it towards your next lease. Our Reply: We are not sure when there would be equity at the end, perhaps if the terms had a very low buyout. Regardless, we will concede that there can be an advantage to being able to walk away at the end of the lease. Actually, we see this as one of the major advantages to leasing, as the leasing company is assuming the risk for the vehicle's resale value. Rest assured though, indirectly you are paying them to accept that risk for you. If this is a main consideration for you, and it often is, then leasing may be your best option, as long as you are doing it with your eyes open.
Lease Company position: It is easier to get lease financing or in the case of a business, it will not interfere with your other borrowing ability. Our Reply: This may or may not be true. If you cannot get other financing, then a lease may be your only option. If it is, first you should reconsider if you are buying more than you can really afford, or need. For a business, keeping all its borrowing capacity available may also be a valid factor, in which case leasing might be the better choice.
Lease Company position: At least one company advertises, or used to advertise that because of their large buying capacity they could provide you with a better vehicle price than the dealers. Our Reply: This may be true, but it seems unlikely that a major Auto Maker is going to sell vehicles cheaper to a leasing company than to their own dealers. Either way, it is usually wise to shop around.
Lease Company position: Leasing is easy with limited hassle. Our Reply: This may or may not be true, however, read the fine print on your lease very carefully, as we have seen people who got burnt because they did not understand all the terms of the lease.
Conclusion: Leasing is not all that it is cracked up to be. You may get into a more expensive vehicle sooner, which has some appeal, but the major cost is that at the end of the day you will have nothing to show for all your payments. It is true that a vehicle depreciates and will never be worth what you paid for it, but with a lease, you will pay continuously and never own anything. So, while we admit that there are times when leasing makes sense, in our opinion, for most people it is not a good option. You will have to decide what is right for you, but be sure to do it with your eyes open.
Return to top of page.
Return to Financial Insight's main page.
![]()
Published: November 1998, November 2001
We are sometimes asked by people who are planning a major future personal purchase, if they should pay cash or borrow. Regardless if the purchase is for a personal asset or an investment, the simple answer is: If the after tax return on your money is lower than the after tax cost of borrowing, use your own money. If not use someone else’s money, provided that the risks and other factors are all acceptable. In this article we will talk about consumer borrowing in Canada (where interest on consumer debt is not deductible). We have talked about leveraging investments in past issues and will continue to do so in the future. Also, if you live in a different country where interest on consumer debt is deductible, the following is still relevant, however, when considering interest costs, you need to consider after tax cost of interest, rather than the full interest cost.
The above concept should be simple enough, however, we are sometimes presented with analysis prepared by salespeople showing that you should borrow. Before we go on, let us make one thing perfectly clear, “The analysis that we have seen have all been incomplete and therefore inaccurate.” Those presenting the figures either did not fully understand them or were deliberately misrepresenting the facts. If their analysis were accurate, we would assume that they would not be selling cars or whatever, they would go to the bank, borrow several million dollars, deposit it and live off the difference. We have yet to meet anyone who was doing that.
The analysis referred to takes the amount you plan to borrow and calculates the amount you would earn on that balance over the life of the loan. Then it takes the debt and calculates the interest you would pay. The interest earned is usually higher than the interest paid, so it looks as if you should borrow. The interest earned is higher because it is on the original principal of the loan and it compounds, while interest paid is on a declining principal. This sounds simple enough, but it is not complete. It assumes that God, or some other higher power will be making the loan payments. Which means that in effect it is comparing two incomes to one. The fact is that the loan is being paid from somewhere, one would assume either from the savings where the interest is being earned or from income. Also, the interest income is taxable, so the return should be adjusted downward to adjust for the tax.
Using some calculations we prepared in 1991 when we first ran this article, let us review how the numbers really work out. The interest rates used below will be higher than what you would find today, but the principles and conclusions will be the same.
First, let us look at using your savings to make payments. In this case, you will not be earning interest on the full balance as the balance will be declining as payments are withdrawn. According to our calculations, forgetting taxes, if you borrow $20,000 at 12% (in the form of a 5 year term loan) and keep your $20,000 in the bank at 10%, then use the deposit to make the loan payments, you will run out of funds after 4.75 years and owe another $1,100 on the loan.
The second option was to keep your money in the bank and use other income to pay the loan. Again, forgetting taxes, if you keep $20,000 in the bank at 10%, borrow the $20,000 at 12% (in the form of a 5 year term loan), and use other money to make the payments, in five years, your $20,000 will be worth $32,906. However, if you had used your money to make the purchase and put the payments, ($445.00 per month), in a bank account earning 10%, at the end of the 5 years, your account would have grown to $34,459. So, if you used your own money you would have been $1,553 ahead.
As you can see, when making a consumer purchase, or any purchase for that matter, unless you can earn a higher return after tax on the money, than the after tax cost of borrowing, you are better off using your own money.
Return to top of page.
Return to Financial Insight's main page.
![]()
Published: March 2001
Good management of your short-term money may not create your retirement fund, but it can make a bigger difference than you think. This can include strategies to reduce your debt, increase the return on money that is available for a limited time, or both. The first thing to determine is the nature of the money and its planned use.
Why Save?
With short-term money, a few main scenarios come to mind. First there is saving for a major purpose, where you will need the money at a specific time. Or you may be saving with the plan to pay down some debt at an appropriate time. Another is when you have excess cash, but it may be required so it is not money that can be included with your investments. Or you are saving for a major purpose, one that you might have borrowed for, so instead you are converting interest expense into interest income.
This last point deserves some special attention. Many of us have borrowed for a major purpose like a car or trailer. While we will not criticize this, we will point out that when you can reverse the equation from making payments to saving for the item, you will have made a major step towards reducing your total costs. We recently had a personal example of this. We just purchased a new trailer for our summer hideaway. We started accumulating the money a little over a year ago. We put it in a separate money market account to earn a secure return and to keep it separate from other funds. When it came time to pay for the trailer, the salesman was somewhat surprised to hear that about $1,000 of the payment came from the interest we had earned on the money over the past year. He was used to people borrowing the money. If we had bought the trailer a little sooner and taken a five-year loan, our interest cost would have been around $6,000. So in effect, the trailer cost us about $7,000 ($1,000 interest income + $6,000 interest saved) less than it would have cost most of his customers.
We had another interesting example of this last summer. Out at the lake we were all admiring a friend's new truck. We could see the wheels going around in another friend's head. He was thinking about a new truck. This friend is very bright and pretty smart about money matters, so we suggested to him that he had a good truck and was in no hurry. We pointed out that if he determined what the payments would be for a five year loan, he could start making them to himself now, then it would probably take about 3 years to save the money. Then he could buy the truck for cash and avoid the debt altogether. We figure that he would be ahead by over $10,000 by doing it this way. He had to agree, and so far we have not noticed him driving around in a new truck, so hopefully he took our advice.
Where To Put Short-Term Money
As we said above, the first thing to determine is what the money is for. If it is for a long period of time, say ten or more years, then you can build a portfolio. However, in this article we are talking about short-term money. Money that you will need in say, less than five years, or maybe next month. While five years is different than one month, in either case, safety becomes a major factor, as you do not have time to recover from a major set back. You do not want to be like the young couple that we recently heard about that tried to grow the money they had saved for their wedding by investing it in tech stocks in early 2000. We gather it was a smaller wedding than they had hoped for.
Once you know your parameters, you can make a decision. If you are sure of when you will need the money, then a high-grade bond that matures before you will need the money or a guaranteed investment certificate may fill the bill and is likely a good choice. However, we warn against bond funds as they tend to be subject to short-term fluctuations and can fall victim to over zealous management. However, in most cases we are talking about less defined periods or money accumulated over time.
Until recently, there have been limited choices for this kind of money, and many of them had conditions attached. Now there are many more options available. Some of the choices include Treasury Bills, Money Market Funds, Term Deposits, Savings Accounts, Special Deposits and now there are high return Daily Interest Savings Accounts. Any of these may fit the bill, however, we recommend that you take a careful look at the accounts offered by the new Schedule B Banks. These accounts are offered in Canada mostly by American Institutions. We are referring to financial institutions like ING Direct and American Express to name a couple. These institutions are offering several different types of accounts, but the most popular seems to be their daily interest savings accounts. These accounts have few if any strings attached. They pay a very good interest rate (ING was paying 4.35% on March 1, 2001), they do not have a minimum balance and you can access your money in a matter of days by transferring it into your regular bank account. The only service charges seems to be the charge your regular bank charges you for depositing and transferring the funds, and this amount should be fairly similar to the service charges for writing a cheque or making a deposit. Also, as these are schedule B banks, most of their accounts are CDIC insured, although you should always check because all banks offer uninsured products as well as insured ones.
Return to top of page.
Return to Financial Insight's main page.
![]()
Published: September 1999, December 2000
First lets talk about the purpose of your fixed income securities. Due to declining interest rates, over the last decade, many investors have made unusually high returns on bonds, the main component of most fixed income portfolios. Then in the last couple of years some have lost money, due to increasing interest rates. As a result, many people are looking at bonds as a growth instrument rather than as a secure instrument. While it is true that bonds can provide unusually high short term growth in times of decreasing interest rates, when rates go up the opposite can also be true, especially if you are holding long term or low quality bonds. In our opinion, the purpose of fixed income securities is to provide the safe portion of your portfolio as well as a reasonable level of return or a steady income. It is your equity investments that are supposed to provide growth.
Fixed income investments like Bonds and Guaranteed Investment Certificates (GIC'S) can provide a good return or income and a high degree of security if you manage them properly. Our recommended strategy is to stick to high quality bonds or GIC's, and to stick to short term instruments (ones due to mature in five years or less). Then hold the securities to maturity and ignore market values in-between. This way, you will earn the interest income and get your principle back, with little risk of loss.
To help you take advantage of higher interest rates and reduce the risk of investing too much during times of low interest rates, it is best to ladder the securities maturity dates over a five-year period. For example, if you had $100,000 to invest, you would invest approximately $20,000 to mature in 1 year, $20,000 in 2 years, $20,000 in 3 years, $20,000 in 4 years and the final $20,000 in 5 years. Then each year, as one fifth of the securities mature, you would purchase new securities that mature in 5 years, thus maintaining the ladder. If you only have a small amount to invest, you might put a third in securities that mature in 1 year, a third in 3 year and the final third in 5 years. Or split the period between two and four years. While not as good as a five-year ladder, for a small portfolio this approach will provide a lot of the same benefits and may be a more practical approach.
This is how we manage the fixed income investments in our portfolios. We consider it to be far superior to speculating in bonds or purchasing bond funds where you may be taking more risk than you bargained for. After all, this is supposed to be the safe part of our portfolio.
Return to top of page.
Return to Financial Insight's main page.
![]()
Published: March 1999, November 2000
This is probably one of the most misunderstood and poorly communicated areas in mutual funds. In Canada there are four basic expenses affecting mutual funds. The first three, often referred to as loads, relate to the sales costs and are paid to the agent of record, while the last one relates to the cost of running the fund. The fees are: Front end sales charges, deferred sales charges, trailer fees and management expenses. The names may change or be interchanged, depending on who you are talking to, but there are still the four main types of fees and expenses. We will attempt to explain each and how they affect your funds, then suggest some strategies to help you make the most of them.
Front End Sales Charge: This is a fee taken off the top when you invest in a fund. Rates normally vary from zero percent to six percent, depending on the fund and the sales agent. If the front end load is five percent, then five percent of your initial investment would go to pay the sales agent/team and ninety-five percent would go into your fund. Funds sold with a front end charge do not normally have a deferred sales charge. Some funds offer a choice between a front end charge or a deferred charge. Many discount brokers are now offering to sell some front end charge funds for a front end charge of zero percent, or no sales charge. This is because they will get a trailer fee of about one percent as long as you stay in the fund. In most cases, full service brokers will negotiate the size of this fee, depending on the level of advice that is expected and the size of the investment. If little service is expected, they might even match the discount brokers.
Deferred Sales Charge: This is a fee taken when you sell or redeem your mutual fund units. It is usually between zero and six percent of the amount taken out or redeemed. However, in most cases the rate depends on how long the money has been in the fund. Often it starts out at six percent, dropping one percent for each year the money was in the fund until year six when it hits zero percent. Many funds will also allow you to withdraw up to ten percent per year without paying this fee. Funds sold with a deferred charge do not normally have a front end charge. Some funds offer a choice between a front end charge or a deferred charge. Often when funds are sold on a deferred sales charge the sales agent/team get a five percent commission up front from the fund company plus a half percent trailer fee as long as you stay in the fund. Many agents claim to prefer this type of fee as they say it encourages you to stay in the fund. We suspect that some like it because the five percent commission plus the trailer fee are hidden from the customer and are not usually open to negotiation. Some Discount brokers are now offering to refund part or all of the five percent commission to the customer in the form of extra units in the fund. They will do this because they still get the trailer fee. Depending on the level of service required, some full service brokers may also be prepared to do this.
Trailer Fees: This is a fee that is paid to the sales agent/team by the fund company. Usually one half to one percent of the money invested. It is paid for ongoing service to the client and for keeping the client invested. This fee is included in the management expenses charged to the fund by the fund company, so while it is sort of buried, it is still covered by the investor.
The above three fees are referred to as loads and are fees that relate to the buying and selling of the fund’s units. A particular fund will normally have none, one, two or all three. Although if the fund has both the front end charge and the deferred charge, it is usually offered as a choice of one or the other. No load funds should not include any of the above charges.
Management Expenses: All funds have some kind of management expenses. These include, but are not limited to: trailer fees (discussed above), broker's commissions, manager's fees, trustee fees, audit, legal, etc. These fees are charged directly to the fund and are therefore born indirectly by the fund holders. The management expense ratio is the total of these fees divided by the total investments of the fund, expressed as a percentage. Normally, fund returns reported by the fund are returns after deducting these expenses. However, it is probably fair to say that it will be difficult for a fund with a high management expense ratio to have competitive returns over the long term.
Fee Strategies
How a fund performs is more important than the above fees. The sales charges are one time and if spread over a long period of time, their effect may be minimal. For example, a five percent one time charge will reduce the size of the investment by five percent. However, as can be seen by the following table, the effect of the management expense ratio is not one time, it is year after year. It’s effect, although buried and only a small part of the return, can have a much greater impact on the total investment, as a decrease in return of one percent per year will reduce the total size of the investment by much more than one percent. Thus the management expense ratio is more important. However, since returns are measured after allowing for these fees, it is the funds total return that is most important. So, we look at the management expense ratio as one of the guides that will help us determine which fund will be able to provide the best total returns. Below the table are some guides for selecting sales charges.
| Investment | 9% Return No Sales Charge |
9% Return 5% Front End Charge |
9% Return 5% Deferred Charge |
10% Return No Sales Charge |
10% Return 5% Front End Charge |
10% Return 5% Deferred Charge |
| $1,000 for 5 Years | $ 1,539 | $ 1,462 | $1,462 | $ 1,611 | $ 1,530 | $ 1,530 | $1,000 for 10 Years | 2,367 | 2,249 | 2,249 | 2,594 | 2,464 | 2,464 | $1,000 for 20 Years | 5,604 | 5,324 | 5,324 | 6,727 | 6,391 | 6,391 |
First, look at the fund's performance, management, management expense ratio, objectives, etc. to determine which fund you want to buy (we have discussed selecting funds in past issues and will continue to in the future). The management expense ratio should be one of many factors you look at, except, if it seems unreasonably high on a particular fund, then it might become a disqualifying factor.
For each selection, if you have narrowed it down to one fund, and there are no choices on front end or deferred charges, then select that fund and live with the charges. However, this may narrow it down to one fund with options on fees or a couple of similar funds. If this is the case, your next step is to determine the level of service you require. If you are getting a lot of advice from a financial planner, then you should expect to compensate them, either directly or through the above fees. If they are simply executing a transaction for you, then they should only expect a small fee.
If you are relying on an advisor, unless you are paying them directly, the choice will likely be a front end sales charge or a deferred sales charge. For example, many funds offer a fund with either a front end or deferred charge. Assuming that you expect to hold the fund for a long period of time and the management expense ratios are similar, then a deferred sales charge is likely your best alternative, since it will likely be little or nothing by the time you redeem the investment. However, some fund companies offer similar funds, one with a front end charge and one with a deferred charge. Again, assuming that you expect to hold the investment for the long term, look at the fund's management expense ratio. Often, in this scenario, the fund with the front end charge has a management expense ratio of between one half and one percent less than the deferred sales charge. If there is a significant difference (e.g. more than one tenth of one percent for each percent of front end charge), then we would lean to the fund with the lower management expense ratio. If not, we would lean toward the deferred charge for the same reasons cited above.
If you are using a discount broker (or full service broker matching discount broker rates) then the circumstances differ a little.
Again, let us assume that you are looking at two options for the same fund, both with the same management expense ratio except one with a front end charge and the other with a deferred charge. If the discount broker is not refunding any of the commission on the deferred charge, but offering a zero percent front end load, select the front end load. This way you know that there will be no front end or deferred charge. If the front end fee is one or two percent, consider how long you expect to hold the fund. If it will probably be long enough to get the deferred charge rate below the front end charge rate, then select the deferred charge. If the broker is refunding part of the fee (in the form of extra units) then assuming you expect to hold the fund for a few years, the deferred sales charge is likely your best option.
If you are looking at two similar funds, one with a front end charge and one with a deferred charge, then look at the management expense ratio. Assuming that all other things are basically equal, you plan to hold the fund for many years and there is a significant difference (e.g. more than one tenth of one percent for each percent of front end charge) in the management expense ratio, take the lower management expense ratio, as in the long run this is likely to have a greater effect than the sales charges.
Another Strategy for Using Discount Brokers:
If you are buying a fund with a deferred charge through a broker that refunds their commission you might be able to increase your return a little by selling the amount of the fund that has been held for long enough to be redeemable with no charge then immediately repurchasing it. In theory, the broker should increase your investment by the amount of commission that they refund and the value of your investment will instantly be boosted by the amount of the refunded commission. Also, some funds allow you to redeem ten percent per year without paying the deferred charge. In those cases, you might redeem ten percent per year and immediately repurchase the same amount, thus slightly increasing your investment due to the refunded commission. Be careful though, if the funds are not held inside an RRSP, you might trigger a capital gain and have to pay some taxes. Also, you are now increasing the time period before the flipped funds can be withdrawn without a deferred charge. Finally, this is a new opportunity, so there may be other pitfalls that we have not thought of yet.
Return to top of page.
![]()
Published: September 2000
We are often asked what is the best way to pick stocks. People want to know if they should use a value approach, a growth approach, a momentum style, rotate from sector to sector or maybe it is wise to stick to small caps, as history has shown that they outperform large caps in the long run. Our answer is always none of the above, or at least none of the above exclusively. Building a portfolio is as much, if not more of an art than a science. It is not just about getting the best return; it is about building a balance between risk and reward. By having a good balance we take advantage of many opportunities while minimizing our losses during down turns. By doing this we hope that in the long run we will get a good sustainable return.
To demonstrate, we decided to take a walk through our personal portfolio. Aside from trying to be fairly well balance between the 5 major economic sectors (Financial, Utilities, Consumer, Resource & Manufacturing), and geographically, which we have discussed before, we try to strike a balance between stocks that can be considered good value, growth stocks and turnarounds. We also try to keep a balance in the levels of risk. We should also note that a stock might be a cross between categories or change categories from time to time.
The value stocks are usually good companies, often with good growth prospects that are currently out of favor. They provide a good base for the portfolio. In a down turn, they usually hold their value, as they were cheap to begin with. Sometimes they even push the overall portfolio up when the market goes down. This is because when investors get nervous they often migrate into these stocks, and consequently push them up. Regardless of the market, these stocks, if carefully chosen will usually provide gains, as sooner or later the rest of the market is bound to notice them. Sometimes sooner than you expect, but they usually require great patience, but we find that patience is eventually rewarded.
Growth stocks are more popular lately. In some cases momentum stocks are all the rage. Momentum stocks are similar to growth stocks, except that it is often only share price that is growing. This leads to comments that the old measures and rules no longer apply, or do not apply to these momentum companies. We believe that sooner or later, investors with this attitude are bound to get burnt. However, we have always liked good quality growth companies. This would include good companies that have a history of growing their profits and good prospects of doing so in the future. Actually, most of the companies in our portfolio fit into this category to some degree. Over the long run, if the companies keep increasing their profits, then their share price is bound to follow. These companies are hard to pick up for a bargain, but the best ones can often be picked up for a fairly reasonable price and occasionally for a bargain. When we want one of these companies we will tend to add a small position as long as the price is not too unreasonable, then increase the position if a bargain comes up. As long as nothing changes, these companies can be held indefately, although because of their growth, sometimes we need to sell some of a holding to rebalance the portfolio.
The final group is the turnaround. In a way these are sort of like value stocks. It is especially important to pay attention to quality here, or you might find that your turnaround is actually a burnout. In this case we are looking at good companies that are cheap because they have had some difficulty. In these cases management is trying to reorganize or restructure the company to get it back up and growing again. Sometimes, we find out that what we thought was a value stock has become a turnaround hopeful as we misinterpreted the reason for the low price. In any case, it is important to evaluate the company carefully so as to distinguish the difference between a turnaround and a burnout. When you get it right, with enough patience, you can be very nicely rewarded, sometimes by several times what you paid, or what it was worth when you almost dumped it. In either case, it was well worth the wait. However, be forewarned, you will not always get it right; we can say that from experience.
You will note that two approaches we do not follow are sector rotation and momentum investing. This is because we do not subscribe to either of these. We think you should concentrate on the quality of the stocks and on holding a well-balanced portfolio. This is something you are likely to get right most of the time, while the others are much more difficult to get right often enough to justify them. Those who do seem to be getting it right are often just on a roll, and you know which way gravity usually makes things roll, don't you.
Finally there is the balance of risk. While we only buy what we consider to be quality stocks, smaller stocks tend to be inherently more risky, but over the long-term can provide exceptional returns. So we try to keep a reasonable balance here too. What is right for you is a personal question, however, we like to have about 60 to 75% in what we consider to be conservative stocks (mostly larger blue chips) and the balance split between what we consider Average (mid-caps) and Higher Risk (smaller-cap) stocks.
This approach of using a mixed approach has served us well. It has allowed us to hold pretty steady (sometimes even to grow) during the slower times and to take part in most of the better markets while having confidence in our overall balance.
Return to top of page.
![]()
Published: July 2000
Recently, we saw a financial show where the interviewer was pressuring an analyst for a price target on a stock. The analyst indicated (as we would have) that he does not set targets. The interviewer continued to push the issue, indicating that without a price target, how would viewers know when to sell. We had to wonder, is this interviewer really working for the viewers, or is he working for a broker.
The thing about price targets is that they suggest that we will be selling the stock, and possibly soon. This makes sense for a trader, speculator or a broker, all who make their living by buying and selling stocks. However, an investor's goal should not be to flip stocks, it should be to obtain a good return on their investments while accepting a reasonable level of risk over a long period of time. That period should be measured in terms of years, if not decades. We have found that the best way to do that is by following our four IFC Investment Principles, and for the stock portion of the portfolio, by buying high quality stocks that we expect to hold for a very long time, perhaps forever. In which case, why do we need price targets?
It is fair to say that we will sometimes sell all or part of a holding in order to rebalance, restructure or because we have changed our mind about the company, but these have nothing to do with price targets. We also find it interesting to note that it appears that the majority of analysts who make recommendations using price targets are somehow connected to brokerage houses, while those who do not are usually independent of the brokerages. Once we had a friend tell us about a smart broker he knew who said that when you buy a stock, you should set a target, and then sell when the target is reached, no matter what. Well, let us dissect that piece of advice.
First, once you sell the stock, you will need to find a new place to park the money. If you have something better in mind, that is fine, but if not, then why did you sell? If so, then why did you wait to sell? Further, as we indicated, if you buy companies that you expect to be able to hold forever, then what target do you set, one for this year, one for next, or maybe one for 20 years from now, but how do you set a target for 20 years from now? This may sound far fetched, but there are lots of great companies that have had healthy growth rates for years, even decades. These companies have grown their earnings for a very long time; as a result their size and share prices have also grown. If we expect the trend to continue, then these must be great companies to hold for a very long time, perhaps forever. So what is the point of a price target? In these cases, a target would rob us of those wonderful future profits that we would have made had we just kept holding the stock. Not to mention that the sale (plus purchase of the replacement stock) would have resulted in more brokerage fees. Well what do you know; price targets are good for brokers.
Return to top of page.
Return to Financial Insight's main page.
![]()
Published: March 2000
Lately there are a lot of complaints about rising fuel costs. However, most of the hostility is aimed at the petroleum industry, when it should be aimed at the government, as at least in Canada, it is the government that is reaping the greatest rewards. Yet they continue to encourage these hostilities at the industry.
First, let us look at the make up of current gasoline prices in Alberta. The price is about 66 cents per litre. This price is made up approximately as follows: All amounts come from sources that we believe to be accurate, however they are not guaranteed.
| Item | Cost per Litre |
Percent of Total Cost |
| Taxes | $0.299 | 45% |
| Crude Oil Cost | $0.268 | 41% |
| Marketing | $0.039 | 6% |
| Refining | $0.056 | 8% |
| Total Cost Per Litre | $0.662 | 100% |
You will note that the various direct taxes make up about 45% of the cost you are paying at the pump in Alberta, where the taxes are the lowest of any province. Also, we believe that for about every dollar per barrel that crude oil costs increase; gasoline cost increases about 1 cent per litre. This suggests that the above price represents a price of about $26 per barrel for crude, which represents the price for crude from the fall of 1999. This represents the approximate time it takes for crude to work its way through the system. We further noted that while the price for crude started to go up in March of 1999 (crude oil was $12.27 on Feb. 28, 1999 and $16.76 on March 31, 1999), at least in Alberta, we did not see the price at the pumps rise until the summer of 1999. The current pump price by the way only represents about a 25% increase, even though the price for crude is up about 2.5 times.
Further, we should point out that the above analysis leaves out a lot of indirect taxes. In Alberta, a petroleum company must pay a fee to acquire the rights to produce a pool (this is done by a bid process). Then they must pay an annual lease rental to maintain that right, then they must pay property taxes for all of their equipment in the field, then royalties on all production. Further, there are the normal taxes of doing business that include Property and Business Taxes on their offices plus Income taxes, when they do make money. Oh yes, making money, something that was very difficult to do in 1998 when the price of crude fluctuated from about $11 to $15 per barrel for most of the year. Funny how there were no irate governments or citizens jumping in to offer to pay more for gasoline then to help the companies survive and ward of the layoffs and bankruptcies that are still happening as a result of that period.
We are sorry, but as far as we can see the petroleum industry is nothing more than a scapegoat for the governments. If they (some governments) think prices are too high, they should decrease the taxes, after all, they are reaping about half of the revenue, (if it cost you $30 to fill your gas tank, the various governments got about $15) for doing nothing and assuming no risk.
The other concern often raised is price fixing; after all, everyone charges the same price. This may sound odd, but this is actually indicative of good competition not poor competition. In a perfect market place for a commodity, everyone charges the same, as no one can raise price without losing all of their business. If one supplier can see fit to lower prices, then all the others must immediately follow, or lose business. This causes prices to stay as low as possible, and although it may not seem like it, this is what is happening as further evidenced by the following:
Return to top of page.
Return to Financial Insight's main page.
![]()
Published: November 1994, February 1997, March 1998, November 1999, December 2000
Nearly everyone has heard of mutual funds. However, many are not sure what they are or do not fully understand them. This leads to generalizations and misconceptions. Therefore, we felt that a discussion of mutual funds was in order.
First we should discuss why mutual funds exist. In the IFC Investment Principles section above, we list four important rules that investors should follow. However, they are not all easy to follow. Principle two, recommends diversifying your investments, but to do this, you need a fairly large portfolio. Principle three, suggests investing in quality, but for the average person, recognizing quality can be difficult. However, if a group of people pool their money, even if the individual amounts are small, the total can be enough to allow diversification and to justify paying a professional or group of professionals to manage their investments.
So, what is a mutual fund? Mutual funds are pools of capital, usually set up in trust by banks, trust companies, insurance companies or investment management companies to accumulate funds from a group of investors and invest them on their behalf.
The fund will usually have a stated objective that describes what kind of investments it will hold. There are many types of funds. There are funds that invest in shares of large companies, small companies, specific industries, specific countries, bonds, government bonds, money market vehicles, treasury bills, mortgages and even real estate. The possibilities are endless. Therefore, it is important that you know the objectives of a fund before you invest in it.
You should also know that the investments are held in trust, usually by a Trust company. This should dispel the myth that mutual funds are always risky. Since the assets are held in trust, the risk level of a fund is related to the risk of the investments in the fund, and not to the financial security of the management company. The creditors of the sponsoring company have no claim on the fund's assets. Therefore, the risk is related to the quality of the investments held in the fund and the quality of the fund's management, not to the financial soundness of the sponsoring company.
So, in a nutshell, a mutual fund is a pool of assets held in trust on behalf of its owners and managed by professional managers in accordance with the fund's objectives.
Most funds are open-ended. This means investors can increase their investments at any time and they can cash in all or part of their investment by giving proper notice (usually 1 working day). This provides the advantage that an investor can get their money out at current market value on short notice. Of course, this can also be a disadvantage. If a lot of fund holders cash in during low markets, the fund manager may be forced to sell investments at the wrong time.
There are also closed-end funds. Closed-end funds are funds where you can only invest or cash in by buying and selling the fund's shares on the open market. Their value is determined by the market place, which may not value the fund at the same value as the fund's holdings. These closed end funds are effectively holding companies and are far less common then open-end funds.
Some of the main advantages of mutual funds are:
Some of the main disadvantages of mutual funds are:
Hopefully the above will help you better understand mutual funds and whether or not they should play a role in your portfolio. When considering mutual funds or any other investments always remember the four IFC Investment Principles.
Return to top of page.
Return to Financial Insight's main page.
![]()
Published: October 1999
There is a lot of debate lately about the value of the market. If you look at standard measures like the Price Earnings (PE) of the Dow or the S&P 500 you would draw the conclusion that stocks are overvalued. Also, in the last few years, there has been tremendous growth in the value of measures like the Dow Jones Industrial Index, much more than the historic growth rate of about ten-percent. Then there are those that say that normal measures do not apply any more, the "this time it is different" scenario. These arguments all hold some validity, but in our opinion, they oversimplify the picture. Let us deal with them one at a time.
Price Earnings Ratio (PE)
The PE of the Dow is currently in the mid-twenties range, while the S & P 500 is in the mid-thirties. These would appear high as in recent History (the last 25 years or so) we have come to expect PE's to be in the ten to twenty range. However, it is more complicated than that. The PE or price earnings ratio of a stock is calculated by dividing its share price by its earnings per share. You might say the PE tells you how many years earnings it would take for a share's earnings to pay for the share. You can also use the inverse to determine the return accruing to an investor from current earnings. That is, if you divide 100 by the PE, you get the current return. So a stock with a PE of 25 is theoretically returning 4 percent. Considering the risk involved, that is not very high, so we might assume that the markets are overvalued. Remember though, when we buy a stock we are buying future earnings, not current or past earnings.
Some of you may recall that essentially our IFC method for valuing stocks is to project future earnings then discount them back and total them. Our premise is that you buy a company for its future profits. Actually, why else would you buy it. This being the case, then in theory, current and past earnings are not relevant, except as a guide to help us predict future earningss. Thus, all other things being equal, a company that is growing its earnings should have a higher PE than one with steady earnings. Since earnings on the whole are growing lately, it is probably fair to expect higher PE's. In addition to this there is the interest rate factor.
We indicated that on the basis of what we have come to expect in the last 25 years or so, PE's are high. This is true, however, you must remember that we just went through a prolonged period of very high interest rates. This was mainly caused by excessive government borrowing and by baby boomers going through the high borrowing stage of their life cycle. These created a very high demand for borrowing, which pushed up interest rates. Since an investor could get a very good return on safer investments like bonds and bank accounts etc., there was less demand for stocks, which pushed down the prices and therefore the PE's. Now that there is more money available and less new borrowing, the required return on all investments is lowering, therefore, we should expect higher PE's than we are accustomed to.
We note that PE's prior to the seventies may have been lower too, however, information and growth were not as good then, so those years are not likely to be a fair comparison.
Phenomenal Market Growth
There is no question that in the last few years the U.S. markets have experienced much higher growth rates than normal. This might be cause for concern. On the other hand, markets often go through prolonged periods of growth, usually adjusting for slower periods, or to adjust to the times. While it might be true that these growth rates are setting us up for a fall, we believe that they are a reflection of what is happening around the world. The efficiencies of computers are finally having a pronounced effect on all aspects of our lives, making the world more global, improving communications, improving people's standard of living, improving corporate profits and creating new opportunities. Yes there will be significant adjustments in the future, but that is nothing new, however, we do not believe that the recent run up by itself is cause for concern. Also, not all companies, nor for that matter the markets of all countries, have grown that fast.
We believe that the biggest concern of the last few years growth rate is that many inexperienced investors will be expecting unrealistically high returns in the future. Historically, stocks have provided a return of about ten-percent per year. We believe that is a reasonable expectation for the future. There will be some better years, but there will also be some worst ones.
This Time It Is Different
There are also some that claim that the world has changed and that the old methods of evaluating stocks no longer apply. They are what you might call the flip side of the doom and gloomers. They believe that the tremendous rates of growth are sustainable, and that it is a mistake to apply the old measures to the new economy and especially the new technology. They believe that this time it is different. Well we have heard that before, and it is not. We are not even leaving room for discussion on this. The basic rules still apply, and those who choose to ignore them will get burnt. This is not to say that PE's cannot be higher, but we have already discussed that. Nevertheless, there are certain rules that always apply, and we have seen nothing to change them. These are rules like; Companies cannot carry unlimited amounts of debt, or a stock's price will eventually reflect earnings.
Let us start with the debt issue. Companies with low debt can better weather the poor times and have more room to borrow and expand during good times. We see it over and over. During good times, there are companies that break this rule and borrow to the hilt. Their bankers let them because the good times are rolling and this time it is different. However, eventually the good times end, and these companies and their bankers get burnt. The second issue is more common today.
There seems to be a proliferation of technology stocks that have very high capitalization values but have never earned a dime. There are experts, or so called experts saying that it does not matter. Well it is true that some will one-day make high enough profits to justify the price, but most will not. Make no mistake, if a company cannot make money, then it is worthless. So what is likely to happen is that many of these companies will disappear before they become profitable, while others will eventually become profitable and their shares will drop because suddenly there is a gauge and investors expectations will become realistic.
Now there are some that are profitable with high PE's that are justified by their growth rates. There are also some that will make profits that will justify their price. But we are sorry, nothing is different as in the end it is still profits that count.
 Markets Vs. Stocks
We did not mention this at the beginning of the article, but it is likely the most important issue. While we love to watch the market indexes, what is important is the individual stocks that we own or might buy. After all, these are what will deliver our returns.
There has been some discussion of market tiers. This is because even in the U.S. where the markets appear to have been booming, there are a great number of excellent stocks that have not. Keep in mind that the ever popular Dow Jones Industrial Average only consists of thirty stocks, and that while some of the other measures like the S & P 500 cover more stocks, they are weighted by market capitalization. What this means is that a very few of the largest companies can make it look like there is a major bull market, even when the majority of stocks are not moving. In recent years there has been a degree of this. So while many of the biggest names may be priced on the extravagant side, there are many other high quality companies that are cheap, or at least reasonably priced. This is especially true in Canada. So maybe the market is overpriced, but the question that should concern you is your individual stocks, not the market as a whole.
Conclusion
We tend to believe that on the whole the U.S. market is on the high side. However, we do not agree with the premise that it is way over priced or with any of the balloon hypothesizes. At worst, on the whole it is ahead of itself, and it might adjust or take a breather, but in the long run it should continue to grow, it is just a mater of when and how fast. Further, we do not agree that things are different and that the old methods of analysis no longer apply. However, as always, they must be applied while considering all the factors, not just a few isolated ones.
As for Canada, we do not believe that on the whole it is overvalued. Actually, we believe the opposite. There are many great Canadian companies that do business on a global scale, are world leaders and can be bought for a very reasonable price.
Regardless of the markets, you need to concentrate on your individual stocks, as that is what really counts to you. Guess that is why they call us stock pickers.
Return to top of page.
Return to Financial Insight's main page.
![]()
Published: February 1998, October 1999
In a word, No! Although it often seems like it. In Canada there are over 2,500 mutual funds. Although, some are actually variations of the same using different fee structures and a few are funds of funds. According to Globe Hysales, total assets managed by these funds is about 430 billion dollars. No doubt about it, that is an incredible amount of money spread out over an incredible number of funds. It makes you wonder if selecting a fund is not more difficult than selecting a stock. Actually, in a sense, there are more funds than stocks for the average investor. Based on a recent Globe Hysales, there are 274 Canadian Equity funds, 112 Canadian Large Cap funds, 107 Canadian Small & Mid Cap funds and 66 Dividend funds. That is a total of 559 funds that are investing money that for the most part would be invested in the TSE 300, if invested directly.
Times have changed. It used to be that there were not that many different funds. Also, we believe that on average, the managers were far more experienced and they moved around a lot less than they do today. Now it seems that every kid with an MBA is being recruited to be the next mutual fund superstar. Obviously this is an oversimplification, as there are some excellent funds with some excellent managers, who have a lot of experience. And these managers are not trying to be superstar's, they are just trying to provide their clients with sound management. Just the same, it is a concern, especially when you couple it with the expectations put on today's managers.
It must be very difficult to be a manager today. The public and the press are constantly scrutinizing your returns. Financial Planners, many who have little experience or qualifications, are trying to tell you how to do your job, investors are switching at the drop of a hat and they seem to have an endless supply of choices. This puts a fund manager in a very difficult spot, because good managers, especially good value managers will often have poorer short term results. Think about it, they may be selling high performers and replacing them with stocks that are out of favor. This approach will often hinder short term performance, as companies are sold before their peak and the out of favor ones may take some time to reach their potential. This manager is looking out for his or her client, yet the client may dump them before they have had time to perform. In the end though, there may be some justice, as that client will probably continue to jump from fund to fund, always selecting one that was a great performer but whose time is over.
Now the above is interesting, but what does it tell us. Well, it says a couple of things. It is going to be very difficult in the future to tell the best funds from the others and very easy to keep changing at the wrong time. So if you have the time and the inclination, you might be better off buying the stocks yourself, or the equivalent of an index like TIPs, HIPs, Diamonds or Spiders, which you can obtain through your broker. Or, when you select your funds, be very careful in choosing your managers. Also, it is probably a good idea to have three or four different managers working for you, then at any given time, you will probably have at least one good performer. This is not really the most encouraging news, but it is something that every fund investor should be aware of.
Return to top of page.
Return to Financial Insight's main page.
![]()
Published: February 1995, May 1997, July 1999
Many planners consider budgets to be the cornerstone of financial planning. However, in real life, most people find that even with good budgets, they still have trouble saving. They plan to set something aside every month, but somehow at the end of the year, nothing has been saved. The bills are paid, but there never seems to be anything left over. Even when income goes up, nothing changes. The reason is elusive, but for most people, this is what happens.
If you are like most people, you face the above dilemma. However, this does not mean that you cannot save, all you have to do is apply the above in a positive way. For example, if your mortgage goes up, you would assume that you cannot afford it, yet somehow you do. Likewise, if you take out a new insurance policy, you probably cannot afford it, but the payments come out of your account, and somehow you cover them. So, why not apply this to your savings.
Nearly all financial institutions, including most Banks, Trust Companies, Life Insurance companies, Brokers and Mutual fund companies offer automatic withdrawal plans.
Automatic withdrawal plans work like loans or insurance policies, except that you are in charge. You make arrangements through your broker, agent or sales representative to have a fixed amount withdrawn from your account every month, and the amount is deposited into the account or fund of your choosing. Some institutions will even allow you to have it divided between a few different accounts or funds.
The money just disappears every month, and human nature being what it is, you find a way to cover it. It is like any other payment, except that the money winds up in your account, not someone else's. Hence the term, "Pay Yourself First." What's more, you have control, and in an emergency, you can always reduce or stop the payments. Even better, once you are comfortable with the payments, you can increase them.
These plans are very simple to arrange, and chances are you can continue dealing with the same people you have always dealt with.
Now, you are probably wondering if the withdrawal amounts must be large. They do not, nearly all Institutions will accept amounts of $100 per month, and many have no minimum. So, you can start small, and if you like, gradually increase the amounts.
Another concern you may have is that small amounts will not add up to much. Well, you may be surprised, and the sooner you start, the more you will accumulate. If the money is invested in an RRSP that makes 10 percent per year, amounts of $50 per month will be worth about $10,000 in ten years; $36,000 in twenty; $104,000 in thirty; $279,000 in forty; and $733,262 in fifty years. But what if you were to gradually increase the amounts?
If you were to start investing $50 per month in an RRSP making 10 percent and increasing the deposit amount by 10 percent a year, in ten years you will have approximately $15,000; in twenty $77,000; in thirty $300,000; in forty $1,036,848; and in fifty years approximately 3.4 million dollars.
Of course inflation will erode some of the growth. But, no matter how you look at it, the plans are a good start, and when you do have extra cash, you can always save it too.
So you thought you had nothing to invest. Then, the automatic withdrawal plan may be perfect for you, and it could make a big difference in your retirement.
Return to top of page.
Return to Financial Insight's main page.
![]()
Published: December 1995, July 1997, December 1997, May 1999
In our first issue (November 1994) we warned against investing in a mutual fund just because it had superior short term results. In 1995, we did some further analysis, and as we wrote then, the results were alarming. Using the Financial Times Bell Charts, for September 30, 1994, we identified the top ten one year performers. Of the top ten, eight were special region/emerging market funds, one was a specialty fund, and one a global small capital fund. It is easy to see why everyone was clamoring to buy emerging market funds that year.
Then we used the Financial Times Bell Charts for September 30, 1995, to determine how the funds performed over the next twelve months. For the twelve months ended September 30, 1995, all of these funds were in the bottom twenty-five percent. Actually, all but two lost money, with the worst return being a thirty-two percent loss and the best a four percent gain. Further analysis showed that four were in the bottom two percent, six in the bottom ten percent and nine in the bottom twenty percent. Further, the best performer a year prior was one of the ones in the bottom two percent, it ranked 966th out of 977 funds, with a twenty percent loss.
These results even startled us. So we decided to take the test one step farther. We asked ourselves, if last years best are among this years worst, where did last years worst performers end up.
Again, we ran a similar test. We used the Financial Times Bellcharts for September 30, 1994, to determine which funds were the bottom ten performers for the twelve months ended September 30, 1994. Then we reviewed their results for the next twelve months. We found quite a variety of results. The returns ran from plus twenty-seven percent to a loss of twenty percent. There were three funds in the top fifty percent, of which two were in the top twenty percent and one was in the top four percent. The other seven were all in the bottom twenty percent, two of which were in the bottom ten percent.
So, in these cases, short term performance really did not indicate much of anything. While these results could hardly be called scientific, they do reconfirm what we have said all along. Short term results can be very misleading. Although, our analysis may make a case for avoiding the current top performers. You know the ones, they are the ones that everyone, especially the press, are talking about.
Return to top of page.
Return to Financial Insight's main page.
![]()
Published: March 1995, May 1997, February 1999
It is about this time every year that Canadians and Americans are combing the financial pages trying to pick the best mutual funds for their retirement dollars. This is one reason that we often see a run up in stock prices during the first few months of the year. In other issues and in future issues, we talk about balance. In this article we will discuss some of the things to look for when choosing equity mutual funds.
First, we should talk about the types of equity funds. In Canada the main choices are Canadian, Small Cap, Special Industry, North American, Special Region and International. Our recommendation is that you stick to the main categories and avoid the specialty funds like special industry and special region.
Special industry funds concentrate on a specific industry. This is great if you choose the right industry each year, but that is not likely to happen very often. However, a well-diversified fund will give you exposure to all industries, allowing you to take advantage of each years winners, while limiting your exposure to the poor performing areas. Likewise, special region funds concentrate on specific regions, sometimes emerging markets. Again, great when you get it right, but how often is that likely to happen. On the other hand, a well run international fund will give you exposure all over the globe, allowing you to benefit from the best regions while limiting your exposure to the more troubled regions. Not to mention that a good North American fund that concentrates on U.S. and Canadian multinational companies will also give you exposure all over the globe, but with the least amount of risk.
Small Cap funds are also an area of great interest in recent years. These funds concentrate on companies below a predetermined size. These companies carry a higher degree of risk, but because of their size, they may have higher growth potential. Studies have shown that over the long term, a basket of small capital stocks is likely to outperform large capital stocks. Still, there are a couple of factors that are often forgotten. The first is that it depends on the basket. In other words, we believe that because of their nature, there is likely to be a much larger spread between the top performers and the bottom performers. Second, more careful analysis of the studies will show that small cap stocks do not always beat large cap stocks. A further analysis of the findings in the widely recognized Ibbotson & Sinquefield study of 1926 to 1987 shows that smaller companies outperformed the larger ones about one half of the time, and that there were long periods of time where larger companies consistently beat the smaller ones, as well as the reverse. So putting some money into a small cap fund is probably a good idea, but be sure not to put too much into them and make sure you have plenty of patience.
Having selected the type of funds, you are left with the task of choosing specific funds. Your best indicator is probably past performance, but it is debatable if even that is a good indicator. That is why we recommend you select about three Canadian equity funds, three North American or International funds and maybe one or two Small Capital funds. We also recommend that for each category you have two or three different managers, otherwise, you might wind up with twins. Of course, unless you are investing large sums of money it makes sense to build up one for a few years then another. This avoids having a very small amount in five or six different funds, but the ultimate goal should be to have a few. On the other hand, we recommend you avoid the urge to hold a portfolio with a dozen or so different funds.
There are numerous sources of information for mutual funds. Some are on the internet, there are services that provide electronic data, newspapers, financial planners plus books and services. Consider the source of each. Some, including the authors of some of the most popular books, make a large portion of their income from the fund companies and/or sales organizations.
Some of the things you can look at are:
The funds return history: Concentrate on its long term returns. Look to see how often over the last ten years it was in the top 50 percent. How consistent was the performance, and how does its 5 and 10 year average annual return compare. Determine how relevant the history was. How long have the current managers been managing the fund? Has it changed significantly. For example, has it changed in size? Sometimes a manager performs very well on a smaller fund, which causes the fund to become very popular and grow exponentially. However, managing a fund worth say 100 million dollars is not the same as managing one worth a billion dollars. If you can, find out if the fund has ever been merged. Sometimes companies merge a poor performing fund with a good performer. Funny how the new name and record often reflect that of the good performer.
Look at the fund's volatility: Standard deviations are readily available. Funds with higher standard deviations are more likely to have less consistent performance.
Some other things that are difficult to find but can be very meaningful are the following.
Beta: Beta is a measure of volatility. A beta of one indicates that the stocks in the fund are likely to move up and down with the same degree of volatility as the market. A beta of less than one suggest that the fund will be less volatile than the market, while greater than one should be more volatile than the market.
Price Earnings Ratio(PE) of the fund: A high PE is an indication that on the whole, the stocks in the portfolio may be overvalued. A lower PE suggests that they may be undervalued.
The Funds Turnover: Does the manager continually buy and sell stocks, trying to pick the next winner, or do they look for quality stocks that they can hold for a long period of time. A low turnover would indicate the latter. We believe that in the long run, managers who buy and hold high quality stocks will have the best performance.
Management Style: In an over simplified form: Bottom up managers look for good companies to invest in and build up the portfolio that way. Top down, determine what the portfolio should look like and look for companies to build that portfolio. Growth investors look for growth stocks, value investors look for bargains that the market may have missed and sector rotators try to move from sector to sector depending on where they think the economy is going. The truth is that all managers are a combination of each, but they place varying emphasis on each depending on their style. We consider ourselves to be bottom up investors who try to buy good companies, with growth potential for a good price. Guess that makes us bottom up value growth investors. The only group we especially dislike are the sector rotators. Since our crystal ball does not work, we refuse to believe that anyone else’s does either.
Finally, read, read, read and listen, but always with a degree of skepticism. Look for good funds and then watch for signs that things are not what they seem. In a way, it is a weeding out process.
Return to top of page.
Return to Financial Insight's main page.
![]()
Published: December 1998
There has been a lot of discussion recently over the markets and how overvalued they are. On the whole, Canadian and U.S. markets probably are overvalued, however, a more relevant question might be: Is your portfolio or mutual fund overvalued? After all, who cares if the markets are dropping if your investments are holding their value. Further, if your investments are not growing or are losing value, it is little consolation to know that the market is taking off. And lets face it, you are not managing the market, you are managing your investments, which are only a small part of the market.
This leads to a number of questions about how to determine if the market or your investments are over, under or properly valued. Actually, in a diverse portfolio, chances are that at any given time, some investments are over, some are under and some are about right. The trick is to determine which is which. In portfolio management, the starting point is to look at all the individual stocks and make buy, hold and sell decisions based on a number of factors. In fact, this is probably the most important part. Over the next several issues, we will be running our stock selection series that will address many of the questions about selecting and holding stocks. However, it does not hurt to take a look at the market, plus your own portfolio, to see how they measure up.
One very popular ratio for measuring the value of a stock is the price earnings (PE) ratio. This ratio is calculated by dividing the price of the stock by the earnings per share (EPS). So, if the stock was trading at $10 per share and its earnings per share was $1, then its PE would be 10 divided by 1 which equals 10. This ratio is very popular as it is easy to calculate, plus the components (share price and EPS) are easily attainable. Not to mention that many newspapers publish PE ratios.
In normal times it is probably one of the most valid ratios. Certainly, it is one of the things that we look at. After all, if you except the notion that in the long run it is earnings that count (something we discussed in our last issue), then this is a critical ratio, as it compares the stock's price to its earnings. If we assume constant earnings, it is a measure of how many year's earnings it will take to pay back the stock. In the above example, the PE ratio was 10. In essence, this is saying that if earnings are constant, then it will take the company 10 years to earn the investment back. Or, if we divide 100% by the PE we get the investment’s return. In this case, 100% divided by 10 equals 10%. If the PE ratio was 20, and again if we assume constant earnings, it would take the investment 20 years to earn the investment back, with a return of 5%. A PE of 50 would take 50 years and equal 2%. This leads us to the question; Why not just buy companies with low PE ratios?
Of course few if any companies earn the same amount year after year. So sometimes we accept higher PE ratios as we are anticipating that earnings will grow, therefore we are prepared to pay a premium for this growth. Also, sometimes we accept what appears to be unreasonable PE ratios, as the current earnings are greatly depressed and for acceptable reasons, do not reflect normal or expected future earnings. So as you can see, while this ratio is very useful, it should never be applied in isolation. Nonetheless, in times of normal or reasonable earnings, this ratio can be a very good indicator of a share’s value.
Now you may be wondering, if this article is about portfolio valuation, then why are we going to town about stock valuation. Well, since a portfolio is just the sum of a number of individual stocks, then it stands to reason that some of the measures of a stock’s value can be applied to the whole portfolio. This is the case with PE ratios. They can be applied to a whole portfolio and provide some very useful insights. Of course, caution is advised as the drawbacks are applicable too.
To calculate the PE of a portfolio, you calculate the earnings of each stock, add them up, then divide the total by the market value of the total portfolio. For example, lets say you had three stocks. Companies A, B and C. Lets say you had 100 shares of each, and the EPS of A, B and C were $1, $2, and $3 respectively. Also, the share prices were $10, $26, and $60 respectively.
The following table gives the details of each share.
| Company | No. of Shares |
Share Price |
Total Value |
EPS | Total Earnings |
P/E |
| Company A | 100 | $10.00 | $1,000.00 | $1.00 | $100.00 | 10 | Company B | 100 | $26.00 | $2,600.00 | $2.00 | $200.00 | 13 | Company C | 100 | $60.00 | $6,000.00 | $3.00 | $300.00 | 20 | Totals | - | - | $9,600.00 | - | $600.00 | 16 |
We divide the total share value ($9,600) by Total Earnings ($600), to get 16 times. So the portfolio’s PE is 16.
The final question is what constitutes a good PE ratio. There are no hard and fast rules, however, under normal circumstances we like to see this ratio fall between 10 and 20 times. Ratios in the higher part of this range may indicate that the stock or portfolio is fully priced and ratios above 20 might indicate they are overvalued. A PE ratio on the lower side would probably suggest good value. Again, we must stress that these are general ranges, and are not always applicable. A security might have a very low PE ratio because its earnings are in jeopardy, or it has little or no growth prospects. Alternately, a sound growth company might have a very high PE, even above the range and still be a bargain, due to its consistent and sustainable growth rate. Also, in times of low interest rates, one would expect PE’s to be higher, as stocks do not have to make as good a return to beat the returns of securities that pay interest.
The following list gives the approximate PE ratio of some indexes plus the Canadian Stock portion of Dave and Marian Heinze’s portfolio (the owners of Insight Financial Corporation). No, we are not going to tell you what is in the Heinze’s portfolio, but we will tell you it’s PE, to help provide some comparison.
TSE 300 = 27
TSE 100 = 22
TSE 35 = 22
Dow Jones = 25
Heinze Cdn. Stocks = 15
The PE ratios of major indexes are published regularly by publications such as the Globe and Mail and The Investment Reporter. Also, some Mutual Fund Software such as the Globe HySales publish the PE’s of some mutual funds. You can also contact the Mutual fund Companies directly and request this information. Unfortunately, we have found that it can be hard to obtain this ratio for many funds, but if enough of us ask for the information, it will become more accessible.
So how does your portfolio stack up. It appears that the market as a whole is somewhat overpriced, although maybe not as overvalued as some would have you believe. If earnings grow as fast or faster than the market, then a major setback could easily be avoided. On the other hand, as we said in the beginning, it is your portfolio that counts, and it is possible to have a portfolio that overall is reasonably priced, even in today’s market. So, we encourage you to calculate your overall PE ratio every now and again, just to see where you stand.
Return to top of page.
Return to Financial Insight's main page.
![]()
Published: December 1998
We often hear the argument that most people can really only invest in mutual funds because it takes a lot of money to build a diversified portfolio. If you assume that you need to hold about 20 shares, (or over a thousand like some mutual funds) then this may be a true statement. We believe that you can build a sound diversified portfolio with as few as three to five shares. Actually, this is our formula for building a portfolio. You start with between three and five stocks. These should be stocks of large diverse multinational companies. If chosen properly, they will become your base portfolio, providing geographic diversification, international exposure and exposure to the five main sectors (finance, utilities, consumer, resources and manufacturing). This can be done with three to five companies, and in the long run it may turn out to be both the most stable and the most profitable part of your portfolio.
There are many large Canadian companies that are very sound, enjoying excellent growth, doing business in more than one sector and doing business all over the world. If you live in the U.S. or another country, there are similar companies in the U.S. and in many other countries. For Canadians, these Canadian ones have the added benefit of being RRSP eligible. With an initial investment of between $5,000 and $10,000, you can start a portfolio of between three and five companies, with about $2,000 invested in each. If necessary, due to share price, you might only buy 50 shares of some companies, but that is okay too. Yes, we know that some believe that you should not buy odd lots due to myths about poor returns and excessive broker fees. We agree that larger amounts can be a little more economical (for broker commissions) but on trades this size, the fee will likely be the minimum fee, which is the same percentage of $2,000 if you buy 50 or 100 shares. As for performance, your trade is of little relevance to the market. Also, these are stocks that will be held for years, maybe never sold, so in the end the broker’s commission is insignificant, especially if you use a discount broker. Once you have purchased these stocks, you will have a core portfolio.
From that point on you can add different stocks, and increase your holdings of the core stocks as well. You can also use mutual funds to provide exposure to areas that you feel that you cannot adequately cover (like small cap or international stocks) or to add greater diversification. At the start you will have an excellent portfolio, and over time you can build a larger more diverse one, which might even be as good as the original core portfolio.
This leads to the next question: How do you find those companies? While we do not make specific recommendations in this letter, there are many publications that do. Two Canadian ones that we like are MPL’s The Investment Reporter and Pat McKeough’s The Successful Investor. Investment Reporter has a large number of stocks that they consider Key stocks, about 50 of which they rate as Conservative or Very Conservative. Of these, they class 6 as multi sector. Using these and other keys you should be able to start a very good base of three to five stocks. The following table lists the six multi sector companies with some details. Below the table we have commented on what the companies do. Please remember that we are not recommending any of these, the list includes all The Investment Reporter’s Keys that they class as Conservative or Very Conservative and as Multi-Sector companies. The information is meant to help you and your advisor find companies that might fit your personal portfolio. Not to mention that at any given time, some will be buys, some holds and some sells.
| Company | Ticker Symbol |
Major Sectors |
Nov. 30/98 Close |
Dec. 31/97 Close |
11 Month Gain(Loss) |
Dec. 31/96 Close |
23 Month Gain/Loss |
| Atco Ltd. | ACO.X | Utilities Manufacturing |
$36.05 | $34.00 | 6.0% | $23.75 | 51.8% |
| BCE Inc. | BCE | Utilities Manufacturing |
$54.45 | $47.65 | 14.3% | $32.65 | 66.8% |
| Canadian Pacific |
CP | Consumer Resource |
$33.85 | $38.50 | (12.0)% | $36.05 | (6.1)% |
| Laidlaw Inc. | LDM | Consumer | $15.35 | $19.50 | (21.3)% | $16.10 | (4.7)% |
| Power Corp. | POW | Financial Consumer |
$34.00 | $25.60 | 32.8% | $13.75 | 147.3% |
| Seagram | VO | Consumer | $52.75 | $46.25 | 14.1% | $54.25 | (2.8)% |
| TSE 300 | n.a. | n.a. | 6344 | 6699 | (5.3)% | 5927 | 7.0% |
| Dow Jones | n.a. | n.a. | 9117 | 7908 | 15.3% | 6448 | 41.4% |
Atco Ltd. Atco is engaged in electric power generation, transmission and distribution; natural gas gathering, processing, transmission, storage and distribution; work force housing and facilities; technical services and facilities management for defense, air transportation and industry. In 1997 approximately ten percent of Atco’s revenue came from foreign interest including the United Kingdom, United States, Hungary, Chile and Australia. Shares in Atco give you exposure to utilities plus some manufacturing.
BCE Inc. Through subsidiaries including Bell Canada, Northern Telecom, Bell Canada International, BCE Mobile and Tel-Direct these shares give you exposure to virtually all aspects of the telecommunications industry. This is mainly a Utility, but it also provides some manufacturing exposure. Of BCE’s 1997 revenue, approximately 46% came from Canada, 34% from the U.S., 15% from Europe and 5% from other areas.
Canadian Pacific Canadian Pacific has interest in Canadian Pacific Railways, CP Ships, PanCanadian Petroleum, Fording Coal and Canadian Pacific Hotels. This gives you significant exposure to both the consumer and resource sectors. Canadian Pacific revenues are approximately 45% from Canada, 45% from the U.S. and the remaining 10% from other countries.
LaidLaw Inc. Laidlaw is engaged in emergency health care transportation, school busing and municipal transit services. It operates in more than 900 locations throughout Canada and the U.S. This company gives you mainly consumer exposure.
Power Corporation of Canada. Power is a diversified management and holding company. It holds approximately 68% of Power Financial (which holds approximately 77% of Great West Lifeco Inc. and 67% of Investors Group Inc.) It jointly holds over 60% of Pargesa Holdings S.A. plus 100% of Gesca Ltee and Power Broadcasting. Greatwest Life and Investors Group are among the largest Life Insurance and Mutual Fund Companies in Canada. This company gives you very good exposure in both the financial and the consumer groups. While it appears that the largest share of Power’s revenue comes from Canada and the U.S., it has substantial holdings all around the globe.
Seagram Co. Ltd. Seagram’s has two global segments, beverages and entertainment. The beverage segment produces and distills spirits, wines, fruit juices, coolers, beers and mixes. The entertainment company is Universal Studios Inc. This company provides wide consumer exposure both domestically and internationally.
Conclusion
As you can see with an initial investment of between five and ten thousand dollars you can easily put together a portfolio of a few shares that give you exposure to a diverse group of industries and global coverage.
Return to top of page.
Return to Financial Insight's main page.
![]()
Published: April 1997, November 1998
When talking about stocks, we discuss the company's prospects, its debt, management, competition, dividends, margins and many other things. While these are very important, we should never forget that what we are really buying is future profits, and after the dust settles, this is the only thing that really counts. The question is, what will the future profits be, and what are they worth when we discount them back? If you know that, then you know what the company is really worth, and you can compare it to the current market value. What is more, in the long run it is probably safe to say that this is what the market value will reflect. Of course in the short run, it may not reflect anything more than current investor emotions.
Now this might sound like a bit of a deviation from our emphasis on quality and management, etc. Nothing could be farther from the truth. The statement that it is future earnings that count exactly reflects our total philosophy. When we evaluate a company, first we evaluate its quality. We run some important ratios, evaluate the trends, examine some other quantitative items and their history. We observe what we can about the company through the press and any other means that we have available to us. This helps us evaluate the quality of the company and its future prospects. This is very important, as it tells a lot about what the future earnings are likely to be and how dependable our projections are. Then, if we like what we see, we analize past revenues, cash flows, dividends and earnings per share to determine what the trends were. This helps us to project future trends, which we use to make predictions about future earnings. Then we discount these future earnings back to a current value. Having done this, we know what the company is worth to us. This may or may not reflect the market, but at least we know what the company is worth to us.
Footnote on Asset Plays
After reading the above, chances are there will be some readers saying, what about asset plays? Sometimes we buy a company because its net assets are worth more than the companies capitalized value. This is true, but an asset is only of value to a business if it can use it to make a profit. This profit could come from the ultimate sale of the asset, or from its use in generating revenue. So we think that in the context of the above article, this can also be considered future earnings.
Return to top of page.
Return to Financial Insight's main page.
![]()
Published: December 1996, October 1998
Every now and then, usually when investors are nervous, people start asking us about short selling. They figure that if the market is going to adjust, they should be able to gain from the adjustment. This approach may sound very cool or sophisticated, and certainly many people have made a lot of money doing it, but it is a very speculative approach.
First we should discuss what shorting is. Normally when we invest, we do what is called going long. That is, we buy an investment, then later we sell it, hopefully for a gain. Going short is the opposite. We sell an investment, which we do not own, in the hopes that we can cover it by buying it later at a lower price. If the investment is a stock, this is done through arrangements with a broker, who keeps an inventory. They can cover the sale until you decide to cover it by buying it at the current price, to replace what you borrowed. If the price dropped as you predicted, you make money, as you bought the share for less than you sold it. Just like going long, except that you sold the share first, then bought it.
At first this may sound pretty good. You can make money in a bull market by buying long, and in a bear by going short. However, before you run out and start shorting the market in anticipation of a continued correction, or an airline that you think is going under, consider the following.
First, even if your predictions are right, there are a couple of pitfalls. If you are in a short position when a dividend is paid, you will have to pay it to the person or organization that you borrowed it from. Since you already sold the share, you will not receive that dividend, so it comes right out of your pocket. Then, if the broker’s inventory runs out, you could be forced to cover the short at an inopportune time, as the loan is actually a demand loan, which the broker can ask you to replace at any time.
Then there is another downfall. What if you are wrong. Normally when you invest long, the most you can lose is your original investment, but the upside is unlimited, as in theory, the investment could grow forever. However, when you go short, the opposite is true. Since you already sold the investment, the most you can gain is the amount you sold it for less brokerage fees and expenses. However, the loss potential is as high the investment can go before you cover the short, which in theory is unlimited.
So, before you run out and start shorting in anticipation of the next drop or bankruptcy, remember, your limited potential gains and unlimited potential losses.
Oh yea, and is it investing. Well, it certainly is speculating, but as for investing, it depends on your definition of investing. It is not investing the IFC way.
Return to top of page.
Return to Financial Insight's main page.
![]()
Published: October 1996, September 1998
We do not have an electronic copy of this article. Take this link to view a pdf copy of the original article.
Return to top of page.
![]()
Published:
We do not have an electronic copy of this article. Take this link to view a pdf copy of the original article.
Return to top of page.
Return to Financial Insight's main page.
![]()
Published: October 1996
We do not have an electronic copy of this article. Take this link to view a pdf copy of the original article.
Return to top of page.
Return to Financial Insight's main page.
![]()
Published: June 1996, February 1997
We do not have an electronic copy of this article. Take this link to view a pdf copy of the original article.
Return to top of page.
Return to Financial Insight's main page.
![]()
Published: May 1995, March 1997, July 1998, April 2000
We do not have an electronic copy of this article. Take this link to view a pdf copy of the original article.
Return to top of page.
Return to Financial Insight's main page.
![]()
Published: April 1997
We do not have an electronic copy of this article. Take this link to view a pdf copy of the original article.
Return to top of page.
Return to Financial Insight's main page.
![]()
Published: April 1997, May 1998
We do not have an electronic copy of this article. Take this link to view a pdf copy of the original article.
Return to top of page.
Return to Financial Insight's main page.
![]()
Published: May 1995, June 1997, July 1998
We do not have an electronic copy of this article. Take this link to view a pdf copy of the original article.
Return to top of page.
Return to Financial Insight's main page.
![]()
Published: June 1995, June 1997
We do not have an electronic copy of this article. Take this link to view a pdf copy of the original article.
Return to top of page.
Return to Financial Insight's main page.
![]()
Published: September 1995, July 1997
We do not have an electronic copy of this article. Take this link to view a pdf copy of the original article.
Return to top of page.
Return to Financial Insight's main page.
![]()
Published: October 1995, October 1997
We do not have an electronic copy of this article. Take this link to view a pdf copy of the original article.
Return to top of page.
Return to Financial Insight's main page.
![]()
Published: December 1994, January 1998
We do not have an electronic copy of this article. Take this link to view a pdf copy of the original article.
Return to top of page.
Return to Financial Insight's main page.
![]()
Published: February 1998
We do not have an electronic copy of this article. Take this link to view a pdf copy of the original article.
Return to top of page.
Return to Financial Insight's main page.
![]()
Published: March 1998
We do not have an electronic copy of this article. Take this link to view a pdf copy of the original article.
Return to top of page.
Return to Financial Insight's main page.
![]()
Published: November 1996, April 1998
We do not have an electronic copy of this article. Take this link to view a pdf copy of the original article.
Return to top of page.
Return to Financial Insight's main page.
![]()
Published: June 1998
We do not have an electronic copy of this article. Take this link to view a pdf copy of the original article.
Return to top of page.
Return to Financial Insight's main page.
![]()
Published: June 1998
We do not have an electronic copy of this article. Take this link to view a pdf copy of the original article.
Return to top of page.
Return to Financial Insight's main page.
![]()
Published: November 1994
We do not have an electronic copy of this article. Take this link to view a pdf copy of the original article.
Return to top of page.
Return to Financial Insight's main page.
![]()
Published: December 1994
We do not have an electronic copy of this article. Take this link to view a pdf copy of the original article.
Return to top of page.
Return to Financial Insight's main page.
![]()
Published: May 1995
We do not have an electronic copy of this article. Take this link to view a pdf copy of the original article.
Return to top of page.
Return to Financial Insight's main page.
![]()
Published: October 1995
We do not have an electronic copy of this article. Take this link to view a pdf copy of the original article.
Return to top of page.
Return to Financial Insight's main page.
![]()
Published: February 1996
We do not have an electronic copy of this article. Take this link to view a pdf copy of the original article.
Return to top of page.
Return to Financial Insight's main page.
![]()
Published: May 1996
We do not have an electronic copy of this article. Take this link to view a pdf copy of the original article.
Return to top of page.
Return to Financial Insight's main page.
![]()
Published: June 1996
We do not have an electronic copy of this article. Take this link to view a pdf copy of the original article.
Return to top of page.
Return to Financial Insight's main page.
![]()
Published: September 1996
We do not have an electronic copy of this article. Take this link to view a pdf copy of the original article.
Return to top of page.
Return to Financial Insight's main page.
![]()
Published: November 1996
We do not have an electronic copy of this article. Take this link to view a pdf copy of the original article.
Return to top of page.
Return to Financial Insight's main page.
![]()
The following are four basic principles that we believe to be the foundation of sound investing practice. By regularly referring to these principles we hope to avoid any major mistakes and ensure a satisfactory return on our long-term results. The four principles are:
1. Balance your investments according to your personal circumstances.
2. Always diversify your investments.
3. Invest in quality.
4. Invest regularly and gradually.
![]()
Return to top of page.
Return to Financial Insight's main page.
If you have any questions or comments, please email us.
To reduce spam, we have removed the period before the com in our email address. Please insert a period between heinzegroup and com to read heinzegroup.com to make the address legitimate. Also, we do use spam filters, which sometimes filter legitimate email, so please confirm that we received your email.
Go to Heinze Group Index Page.
![]()
